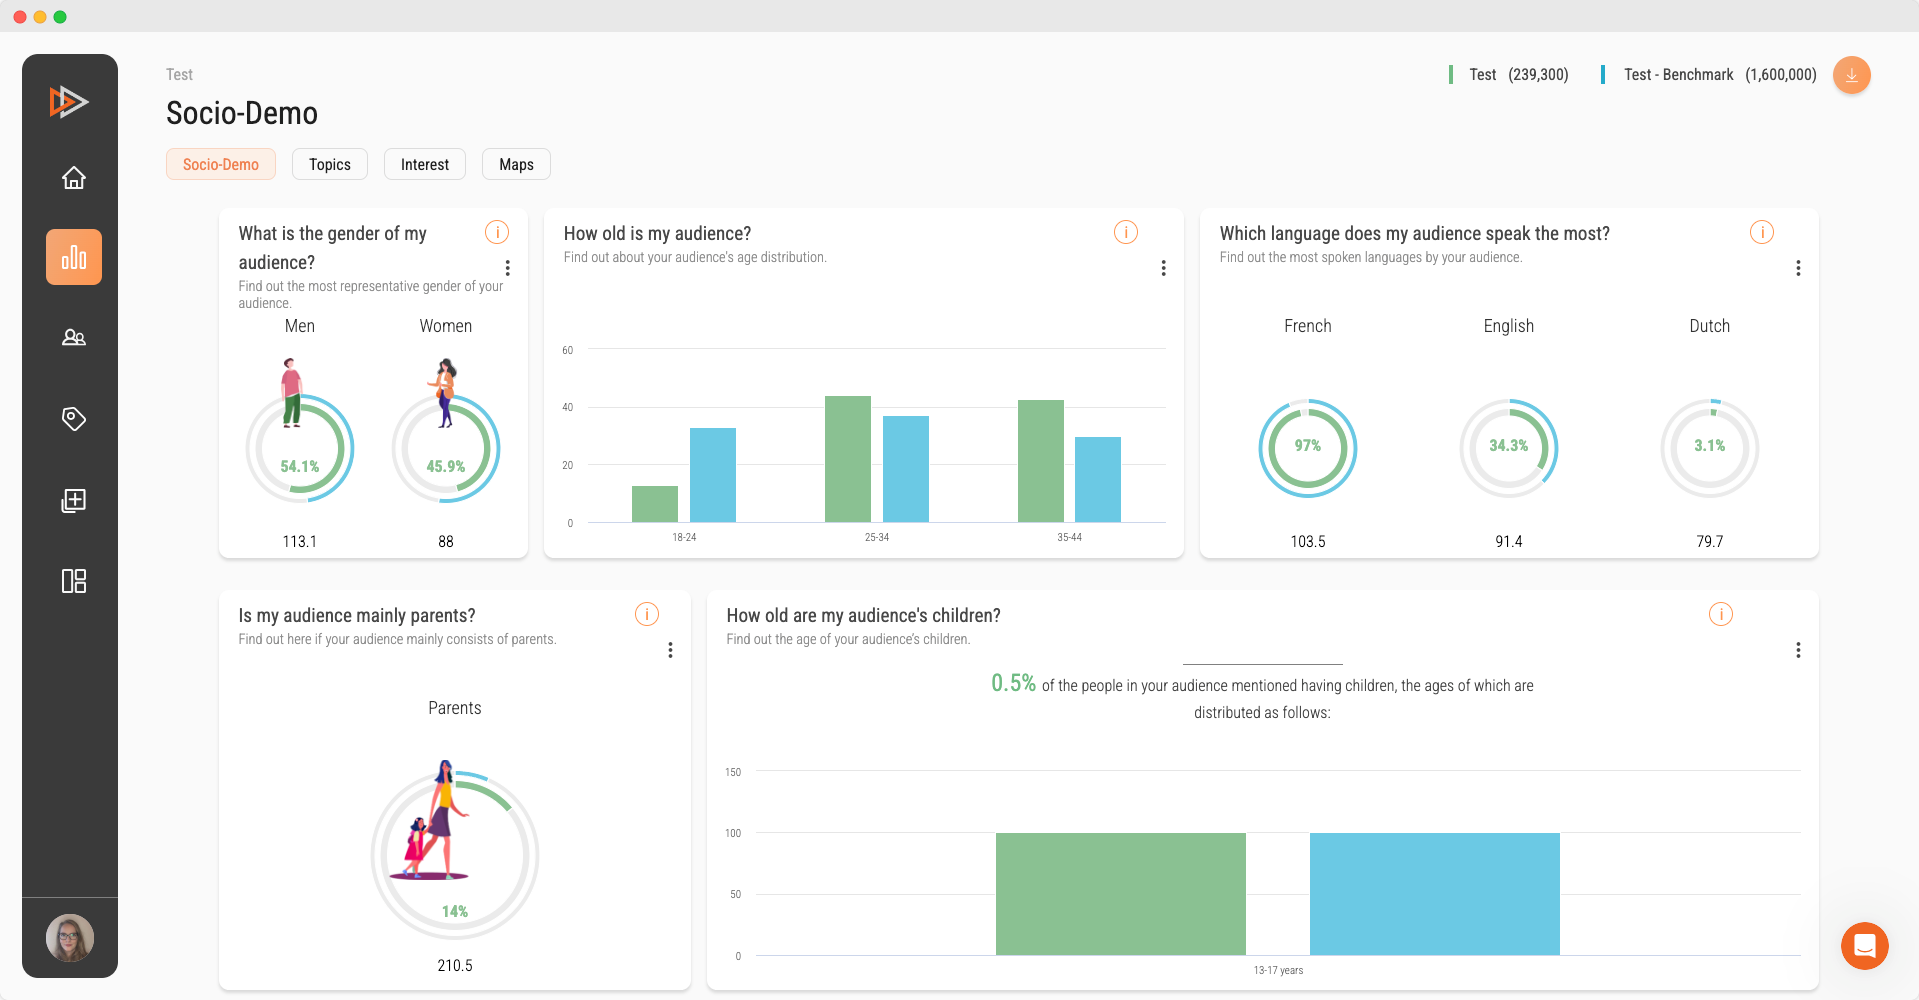
This tab displays a number of different demographic graphs illustrating the socio-demographic characteristics of your audience by comparing the target (green) and baseline (blue) audiences. Socio-demo insights are based on declarative data, which means that is what people have told or mention to Facebook.
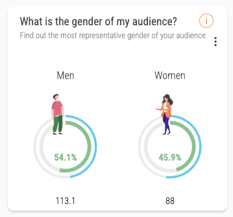
Gender
Distribution by gender and its difference versus the baseline.
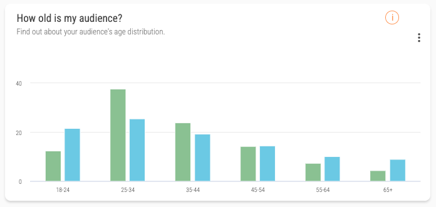
Age
Distribution by gender and its difference versus the baseline.
The ages are divided into 7 distinct age groups (13-17; 18-24; 25-34; 35-44; 45-54; 55-64 and 65+).
Language
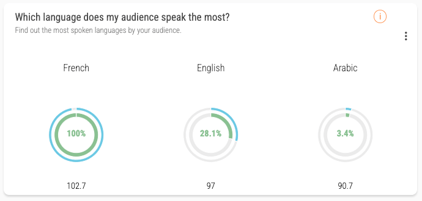
Distribution by most spoken languages and its variance from the baseline.
📣 A person can speak more than one language, so the sum of all the percentages can be more than 100%.
Parental Status
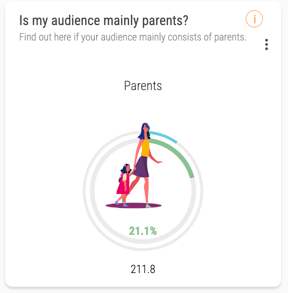
Distribution by parental status and its variance from the baseline.
Children's Age
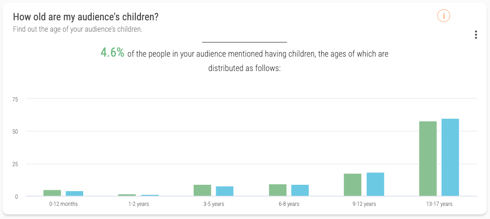
Distribution by the children's age and its variance from the baseline. You also have the % of the people in your audience that have mentioned having children.
The ages are divided into 6 distinct groups (0-12 months; 1-2 years ; 3-5 years; 6-8 years; 9-12 years; 13-17 years).
Relationship Status
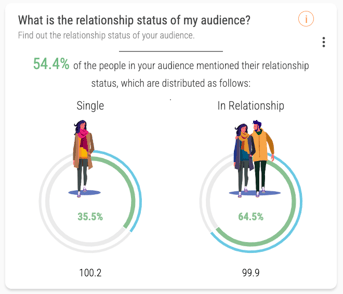
Distribution by relationship status and its comparison to the baseline. You also have the % of the people in your audience that have mentioned their relationship status.
Educational Status
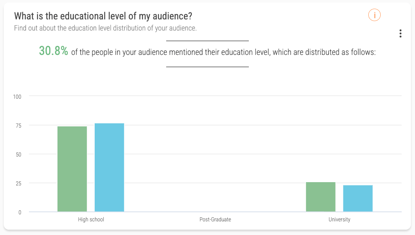
Distribution by educational status of the audience
