Audiense Personality Insights with Watson uses the power of IBM Watson to segment by personality and deliver rich insight into audiences and influencers.
Define audiences by personality, relationships and content and use this strategic insight to reach these audiences more effectively with messages which can be fashioned according to each individual’s response. Personality driven campaigns which are highly targeted improve campaign efficiency enormously and impact on social marketing strategy.
Note: This feature is only available for users with a Twitter Marketing plan or an Audience Insights plan. Users with a Free plan will not be able to see this as an available option.
Audiense Personality Insights is based on three models:
- The Big Five personality model describes how a person engages with the world in terms of five primary dimensions: Agreeableness, Conscientiousness, Extraversion, Emotional Range, Openness.
- The Needs model describes which aspects of a product are likely to resonate with the author of the text.
- The Values model describes motivating factors that influence the author’s decision-making.
Create a Personality Insights report
1. On the community wall prepare the user set whose personality you want to analyse.
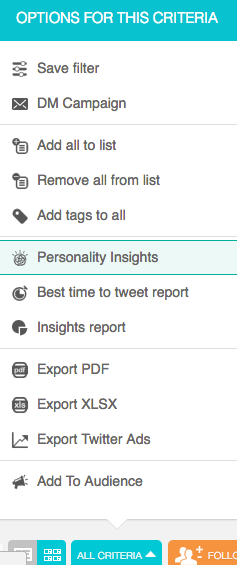
2. Click Personality Insights from the all criteria drop-up menu on the community bottom bar.
3. Give the report a title, and you can see the number of users to include in the report. The maximum number of users you can analyse is dependent on the plan you have.
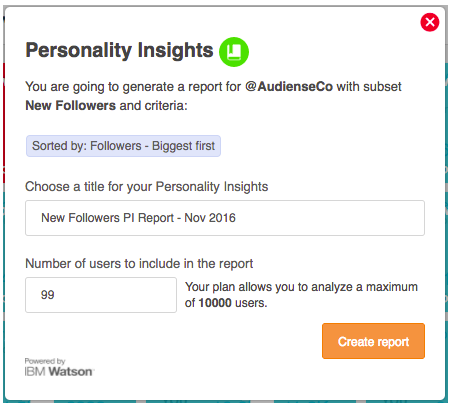
4. Click create report. It may take a while but Audiense will send you a message when your report is ready.
View a Personality Insights report
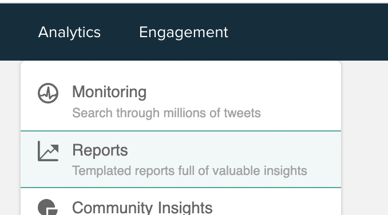
1. Go to Analytics > Reports from the top menu bar.
2. You will see the reports home screen.
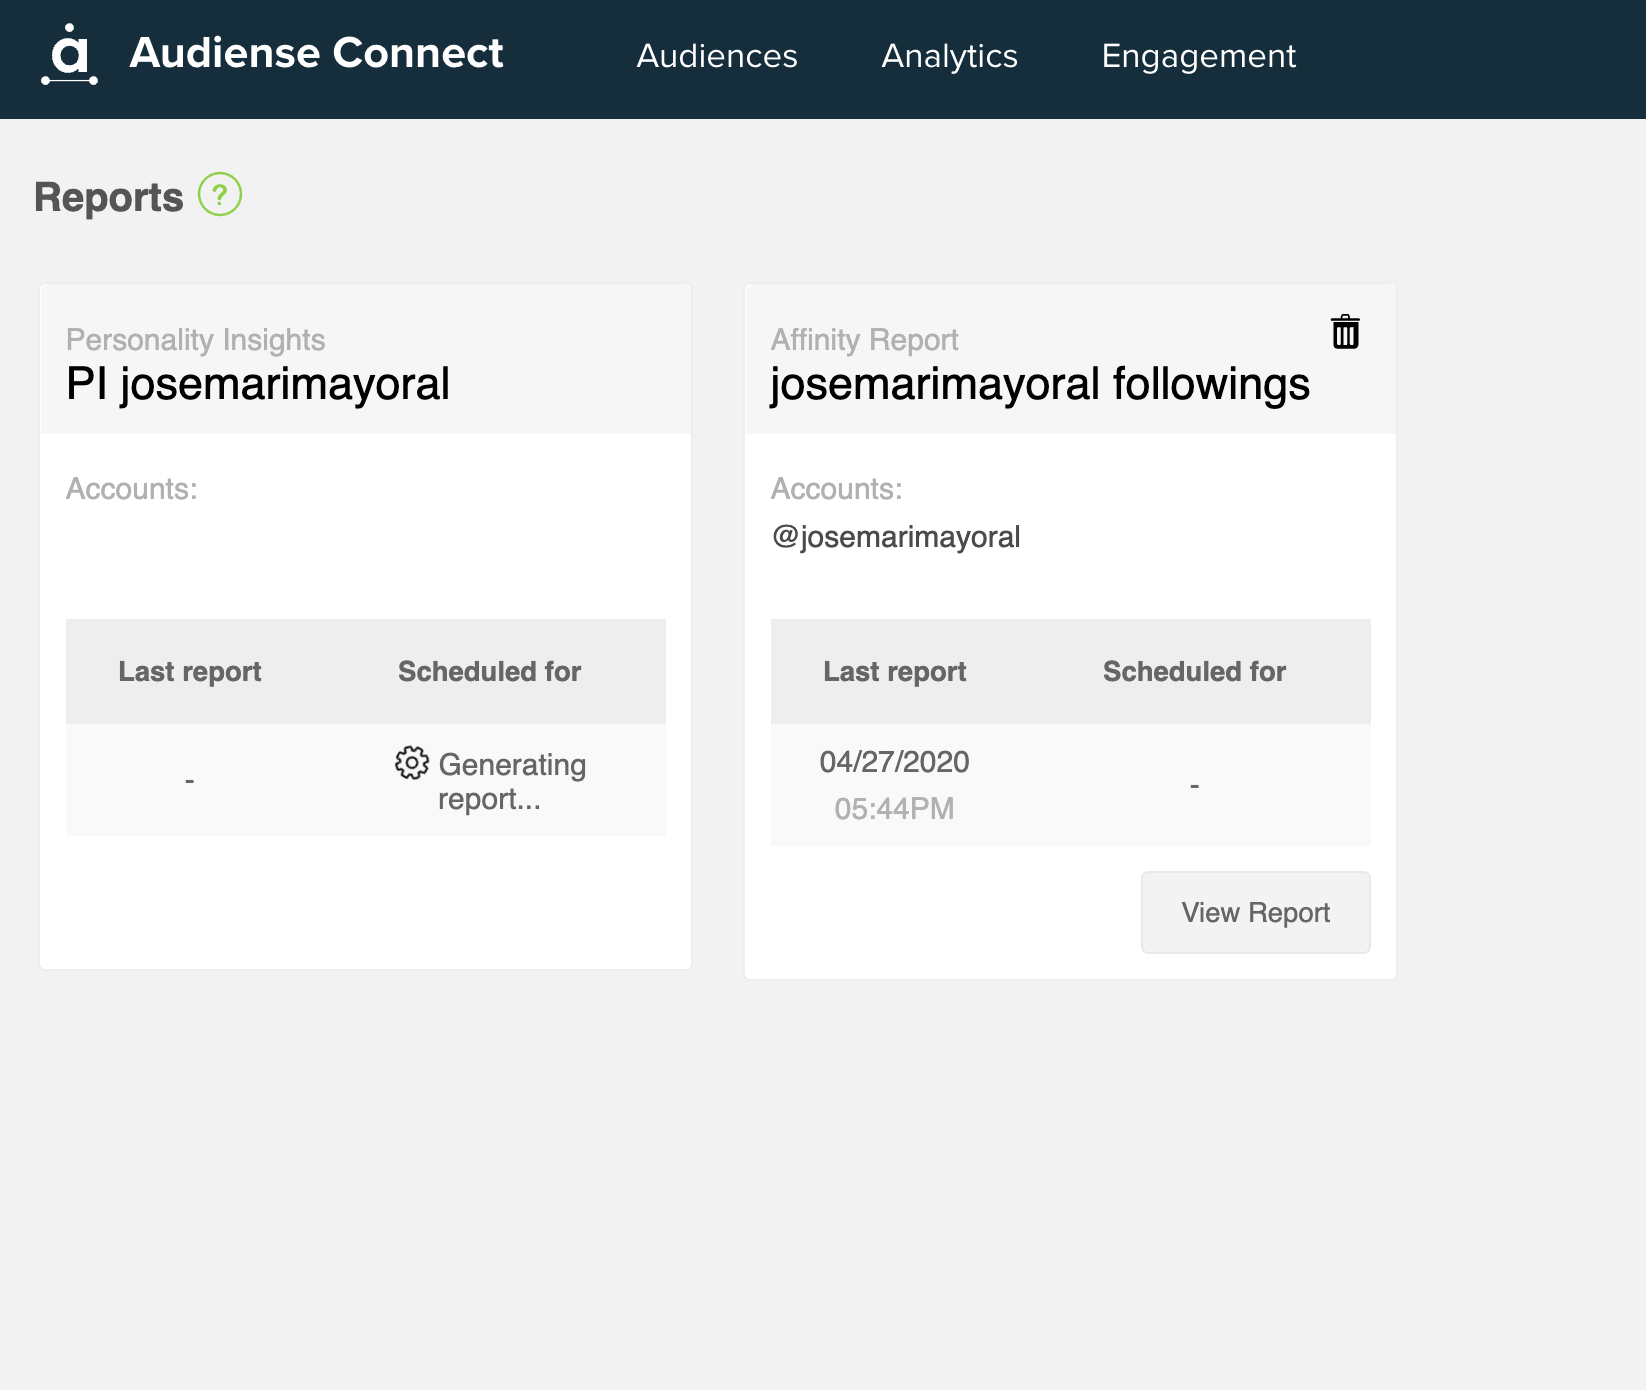
Each Personality Insights report you have previously generated is represented by a panel.
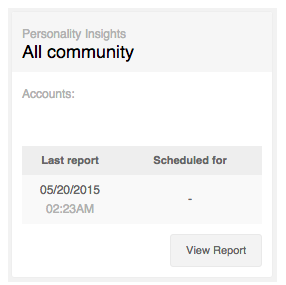
3. Click view report to see the insights associated with that report.
OPTIONAL. Click export on the breadcrumb bar to download the report to your computer; choose PDF for the colour graphics or Excel for the raw data (see example at the bottom of this post).
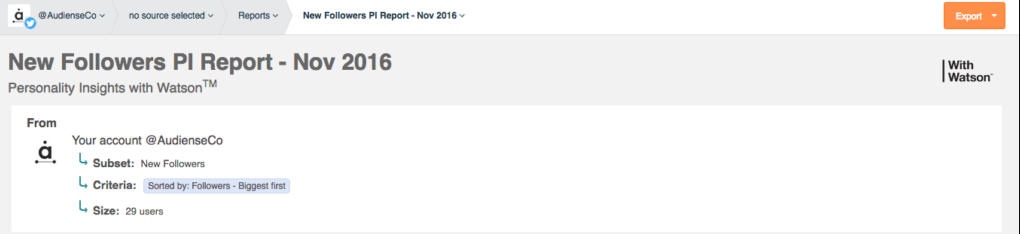
The summary panel shows the account, subset and any criteria you used to create the report.
It also shows the size, i.e. the number of users the report is based on. As in the example below this number (29) may not coincide with the original number of users in the report (99 – see create a PI report image above). If the user hasn’t Tweeted enough words in their latest Tweets it’s impossible to reach any meaningful conclusion about the personality of that user by analysing the Tweets.
There are three main panels which show in graphical format the Personality Insights:
- Big Five – Engagements with the world.
- Needs – Desires that a person hopes to fulfill from a product.
- Values – Motivating factors which influence decision-making.
Big Five panel
This panel shows the Big Five personality characteristics which describe how a person engages with the world. The graph shows the five primary characteristics together with the percentage of people who clearly demonstrated a high level of this characteristic.
Big Five characteristics
- Agreeableness is a person’s tendency to be compassionate and cooperative toward others.
- Conscientiousness is a person’s tendency to act in an organised or thoughtful way.
- Extraversion is a person’s tendency to seek stimulation in the company of others.
- Neuroticism, or Emotional Range, is the extent to which a person’s emotions are sensitive to their environment.
- Openness is the extent to which a person is open to experiencing a variety of activities.
Mouseover each facet, e.g. self-consciousness, to read a short description of each. The percentage shown for each property associated with the facet is the percentage of people who clearly demonstrated a high level of this property.
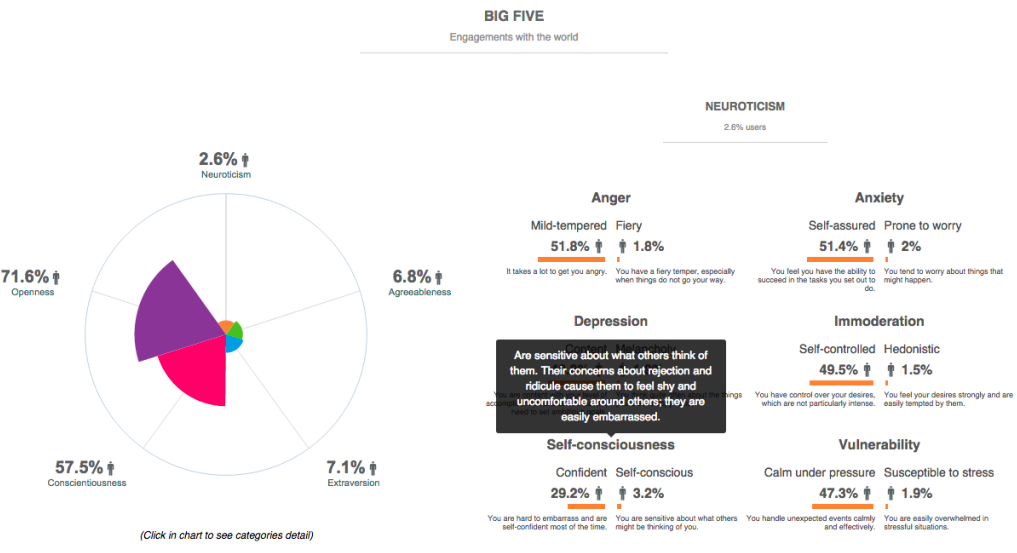
Click each characteristic in the chart to see a breakdown of the six facets and two properties of each facet that further characterise the users included in the report according to that general characteristic.
Agreeableness facets and properties
- Altruism – Altruistic or Self-focused
- Cooperation – Accommodating or Contrary
- Modesty – Modest or Proud
- Morality – Uncompromising or Compromising
- Sympathy – Empathetic or Hard-hearted
- Trust – Trusting of others or Cautious of others
Conscientiousness facets and properties
- Achievement-striving – Driven or Content
- Cautiousness – Deliberate or Bold
- Dutifulness – Dutiful or Carefree
- Orderliness – Organised or Unstructured
- Self-discipline – Persistent or Intermittent
- Self-efficacy – Self-assured or Self-doubting
Extraversion facets and properties
- Activity level – Energetic or Laid-back
- Assertiveness – Assertive or Demure
- Cheerfulness – Cheerful or Solemn
- Excitement-seeking – Excitement-seeking or Calm-seeking
- Friendliness – Outgoing or Reserved
- Gregariousness – Sociable or Independent
Neuroticism facets and properties
- Anger – Fiery or Mild-tempered
- Anxiety – Prone to worry or Self-assured
- Depression – Melancholy or Content
- Immoderation – Hedonistic or Self-controlled
- Self-consciousness – Self-conscious or Confident
- Vulnerability – Susceptible to stress or Calm under pressure
Openness facets and properties
- Adventurousness – Adventurous or Consistent
- Artistic interests – Appreciative of art or Unconcerned with art
- Emotionality – Emotionally aware or Dispassionate
- Imagination – Imaginative or Down-to-earth
- Intellect – Philosophical or Concrete
- Liberalism – Authority-challenging or Respectful of authority
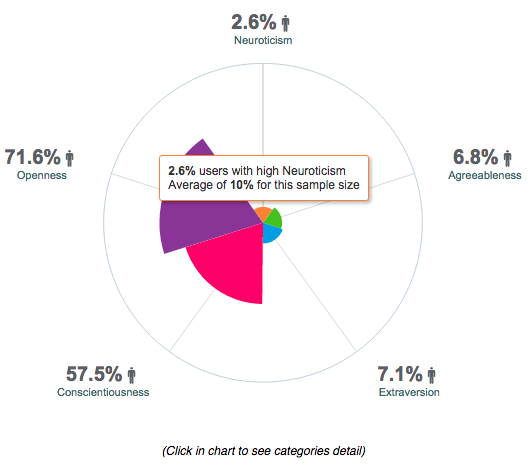
Mouseover each colour of the pie chart to see the percentage of people who clearly demonstrated a high level of this characteristic and the average percentage value of this characteristic amongst the users.
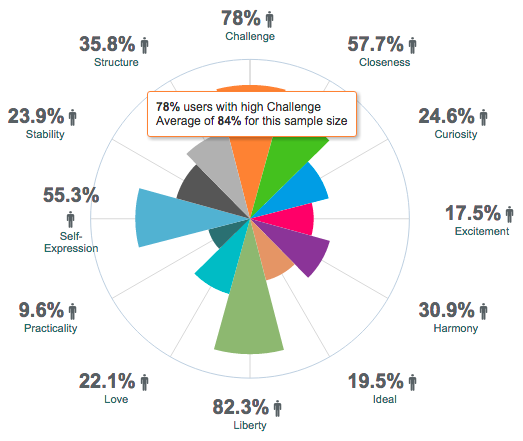
Needs panel
Needs describe which aspects of a product will resonate with a person. There are twelve characteristics of needs which are evaluated in the report.
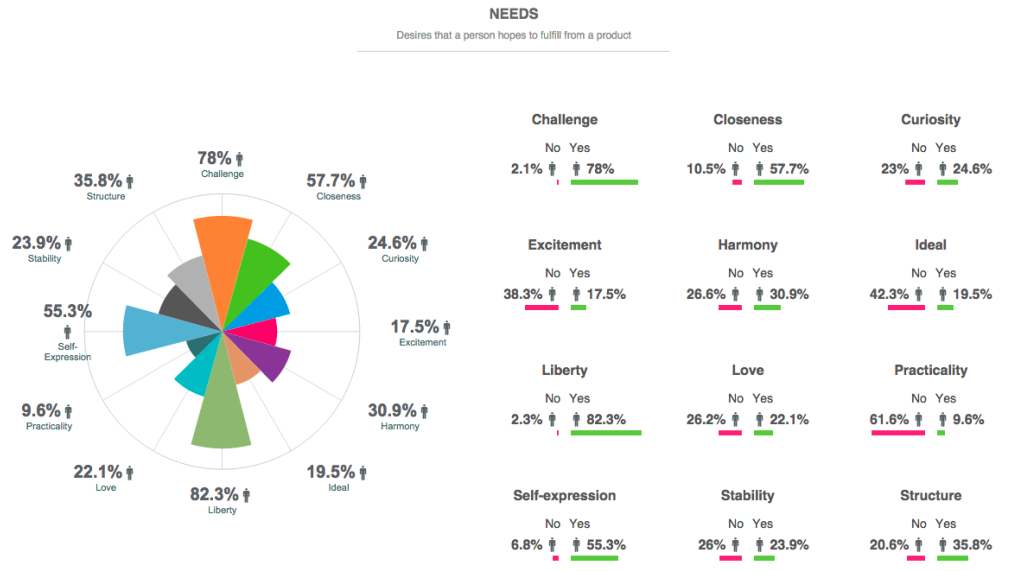
People who score highly for each characteristic demonstrate the following qualities:
- Excitement – Want to get out there and live life, have upbeat emotions, and want to have fun.
- Harmony – Appreciate other people, their viewpoints, and their feelings.
- Curiosity – Have a desire to discover, find out, and grow.
- Ideal – Desire perfection and a sense of community.
- Closeness – Relish being connected to family and setting up a home.
- Self-expression – Enjoy discovering and asserting their own identities.
- Liberty – Have a desire for fashion and new things, as well as the need for escape.
- Love – Enjoy social contact, whether one-to-one or one-to-many. Any brand that is involved in bringing people together taps this need.
- Practicality – Have a desire to get the job done, a desire for skill and efficiency, which can include physical expression and experience.
- Stability – Seek equivalence in the physical world. They favour the sensible, the tried and tested.
- Challenge – Have an urge to achieve, to succeed, and to take on challenges.
- Structure – Exhibit groundedness and a desire to hold things together. They need things to be well organised and under control.
Mouseover each colour of the pie chart to see the percentage of people who clearly demonstrated a high level of this characteristic and the average percentage of this characteristic amongst the users.
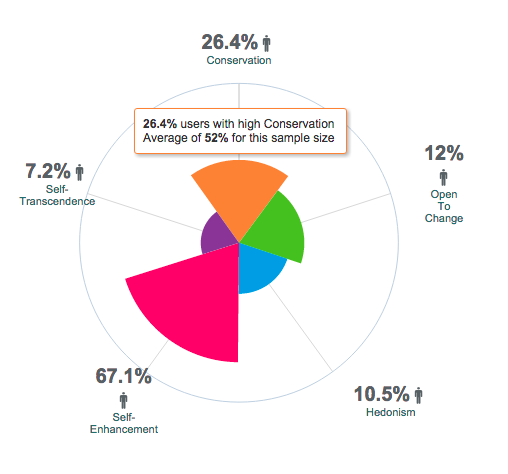
Values panel
Values describe motivating factors that influence a user’s decision-making. There are five dimensions of human values which are evaluated in the report.
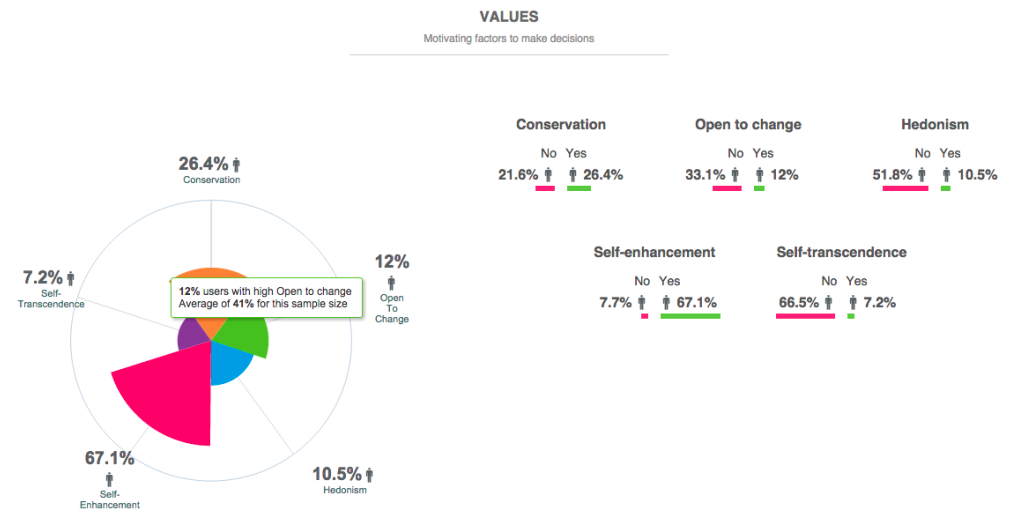
People who score highly for each value demonstrate the following qualities:
- Self-transcendence – Helping others. Show concern for the welfare and interests of others.
- Conservation – Tradition. Emphasise self-restriction, order, and resistance to change.
- Hedonism – Taking pleasure in life. Seek pleasure and sensuous gratification for themselves.
- Self-enhancement – Achieving success. Seek personal success for themselves.
- Open to change – Excitement. Emphasise independent action, thought, and feeling, as well as a readiness for new experiences.
Mouseover each colour of the pie chart to see the percentage of people who clearly demonstrated a high level of this value and the average percentage of this value amongst the users.
An example of the Excel spreadsheet raw data.
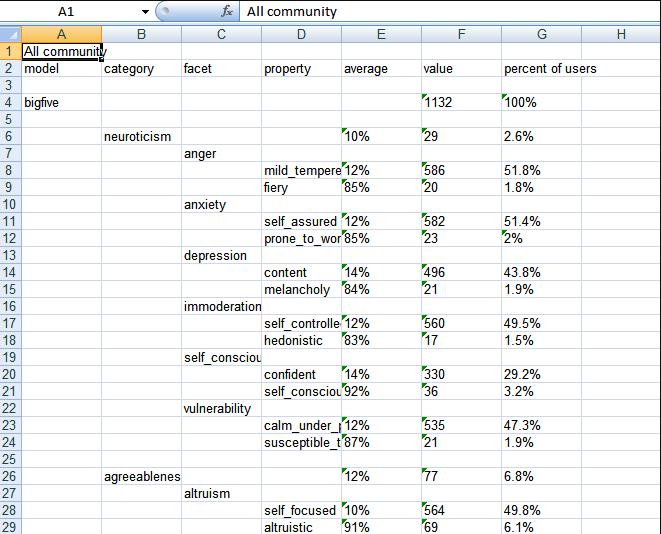
Columns are:
- Model – E.g. Big Five; Needs; Values
- Category – E.g. Neuroticism; Challenge; Conservation
- Facet – E.g. Anger
- Property – E.g. Mild-tempered, Fiery; Yes, No
- Average – The average percentage of this amongst the users.
- Value – The number of users who clearly demonstrated a high level of this.
- Percent of users – The percentage of people who clearly demonstrated a high level of this.
Notes
Personality Insights can only infer characteristics from English, Spanish, Arabic and Japanese language text.