Find meaningful intersections and understand the relationships between audiences to gain the intelligence you need to focus on specific target audiences. See how effective the social strategy of each is and see which accounts from similar market sectors have a similar number of users and which have a high number of exclusive users.
Limitations:
- You can compare any public accounts, regardless of size. However, Audiense cannot access protected accounts.
- The accounts used in the comparison do not impact your plan’s social contacts and do not need to be added as sources in your Audiense account.
- You can add a minimum of two and a maximum of 20 accounts (followers or followings), and you can also compare up to 20 Source Members (audiences) within the same report.
Note: Audience Intersection Reports are only available to users on a Twitter Marketing or an Audience Insights plan. Users with a Free plan will not be able to use this feature.
Create an Audience Intersection Report
Go to Analytics>Reports and click Create.

Use the template drop-down menu to select the Audience Intersection Report.

Choose One Audience Type:
You can select Account Followers, Account Followings, or Source Members, adding up to 20 accounts or sources - but you cannot mix these options in the same report.
- Account Followers: Add up to 20 accounts (@account).
- Account Followings: Add up to 20 accounts.
- Source Members: Select a pre-built audience (up to 20).
For example, you can compare 20 Account Followers or 20 Source Members, but not a mix of both.

For Account Followers intersection data, enter the @username of each account - ensuring accuracy by copying/pasting each one.
- If an account is invalid or protected, a red box will indicate the issue.
- The @ sign is optional when entering usernames.

View an Audience Intersection Report
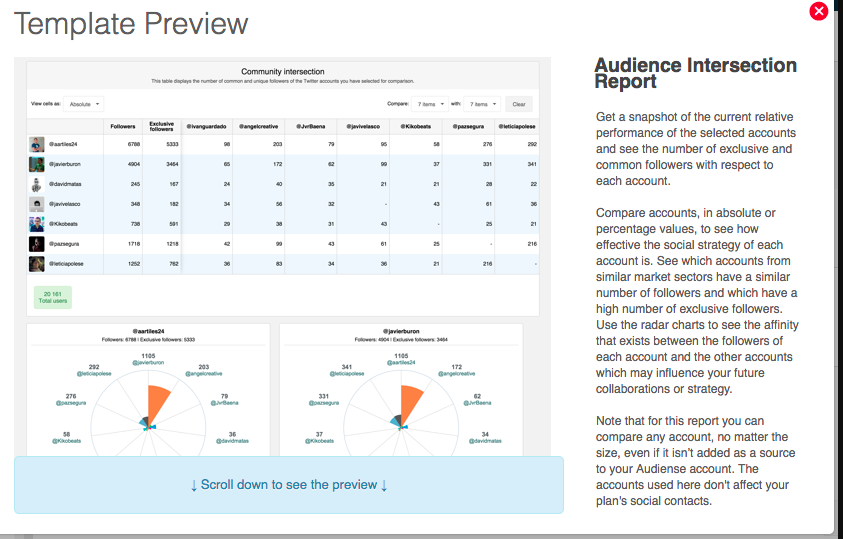
The Audience Intersection Table helps you compare selected audiences by showing:
- Total Users & Exclusive Users (first two columns).
- Shared Users across different audiences (rows).
Important Notes:
- The total number of users (bottom-left, green box) represents unique users - a follower of two accounts is counted only once.
- No data appears where an audience intersects with itself.

Refining Your Audience Intersection Table
To make comparisons easier, you can reduce the number of rows and columns by deselecting audiences using the "Compare [ ] with [ ]" drop-down menus. This helps focus on the most relevant data while decluttering the table.

Customizing Your Audience Intersection Table
- Restore Audiences: Add back individual audiences or click "Clear" to restore all.
- Change Data View: Use the "View cells as" drop-down to switch between absolute values and percentages for better comparison.

Visualizing Audience Overlap with Polar Area Charts
Below the table, polar area charts display the affinity (overlap) between audiences, helping you identify connections that can shape your strategy or collaborations.
Key Notes:
- These charts appear only when comparing three or more audiences.
- They provide a visual representation of shared users across selected audiences.

