Update: You can now run an Audiense Insight report for a more detailed and advanced analysis on your followers or selected audience, including the audience segment breakdown. Follow the steps here.
See detailed information and gain insights about any audience. Understanding the characteristics of a specific audience in your market is powerful knowledge which can influence strategy to help reach users more effectively.
See here how to view all your Community Insights reports.
There are two types of CI report:
- Default Insight report
- Custom Insight report
Create a custom Insights report
1. Build the audience you are interested in on the community wall and refine with the search/filter sidebar.
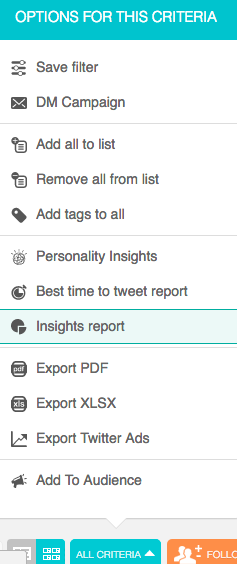
2. Select Insights report from the all criteria drop-up menu on the community bottom bar.
3. Give your report a title and optionally upload a custom logo from your computer.
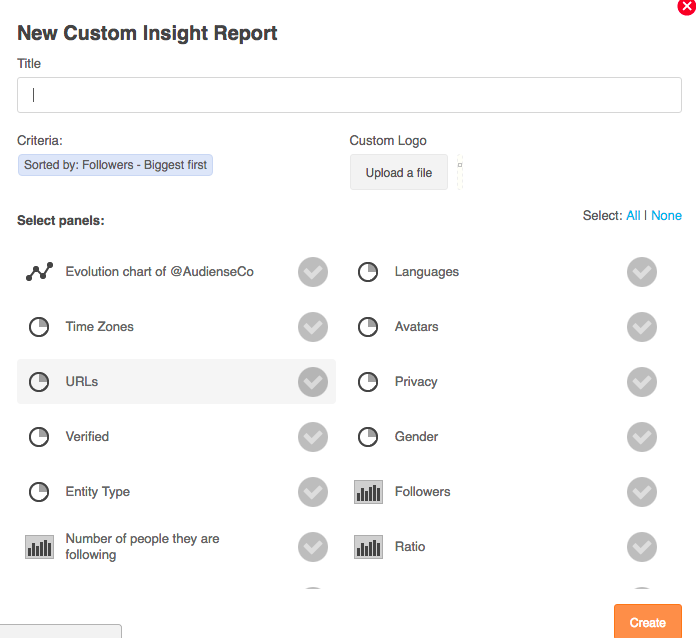
4. Select the panels for your report either individually or use the select: all | none options to speed up selection. You must select a minimum of one panel.
Panels can take the format of:
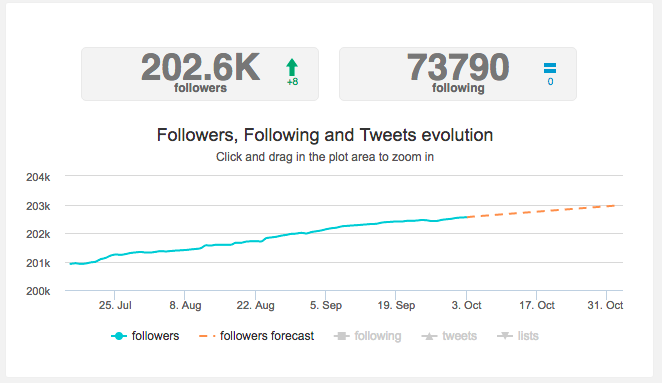
- [1] Line graphs, e.g.
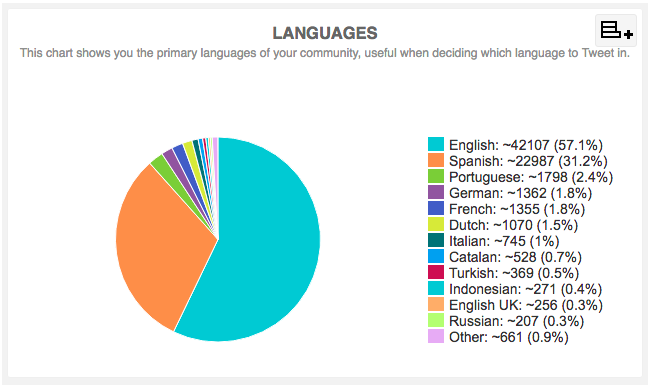
- [2] Pie charts, e.g.
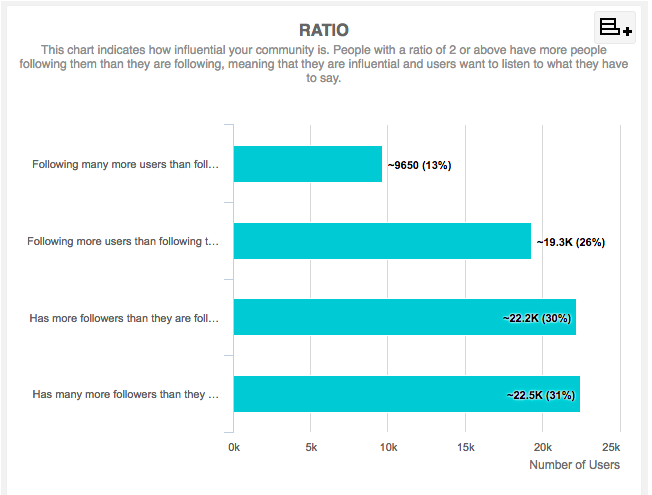
- [3] Bar charts, e.g.
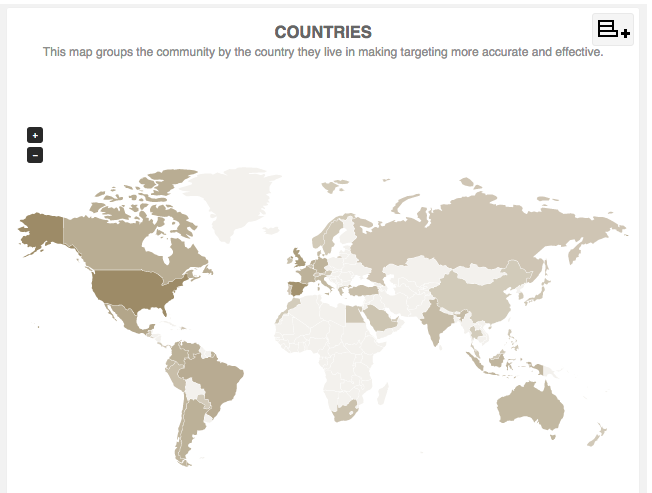
- [4] Maps, e.g.
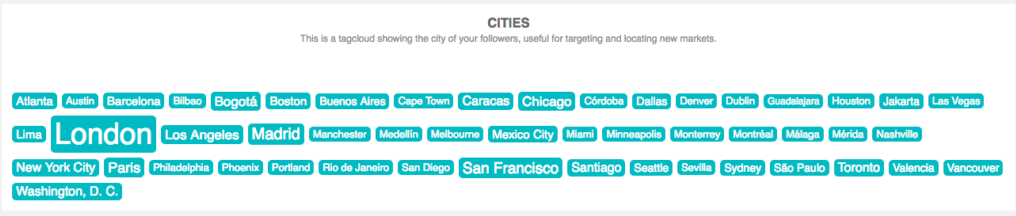
- [5] Tag clouds, e.g.
The panels available, with the format in square brackets, are:
- [1] Evolution chart – The evolution over time in terms of followers, following, Tweets and lists.
- [2] Languages
- [2] Time Zones
- [2] Avatars – Custom or Default avatars.
- [2] URLs – Does the user have a link in their bio?
- [2] Privacy – Public or Private profile.
- [2] Verified – Non-verified or Verified profile.
- [2] Gender – Male, Female or Unknown
- [2] Entity Type – Individual (personal) or Corporate profile.
- [3] Followers – Users grouped by the number of followers they have.
- [3] Number of people they are following – Users grouped by the number of people they are following.
- [3] Ratio – Users grouped by their ratio of followers/following.
- [3] Time Since Last Tweet – Users grouped by their recent activity level.
- [3] Tweets Per Day – Users grouped by the Tweets per day.
- [4] Countries – Indicates where the community is located in terms of country.
- [5] Cities – Indicates where the community is located in terms of city.
- [5] Locations – Indicates where the community is located in terms of country and city.
- [5] Bio – Indicates the interests of the community.
5. Click create when you’ve selected your panels. It may take a few minutes to generate the report but you can navigate away and continue working.
Notes
The default Community Insights report uses all the panels that are available for a custom report but excludes:
- [1] Evolution chart – The evolution over time in terms of followers, following, Tweets and lists.