You’ll notice that that there will be two bars in the graph charts. This shows your selected audience (top bar) against your selected baseline (bottom bar).
This comparison allows you to understand what is unique to this segment/audience. When you are viewing the insights for your analysed audience, the default baseline will be the ¨Global¨ audience. However when you are viewing the insights for one of the segments, the default baseline will be the original full audience analysed in the report.
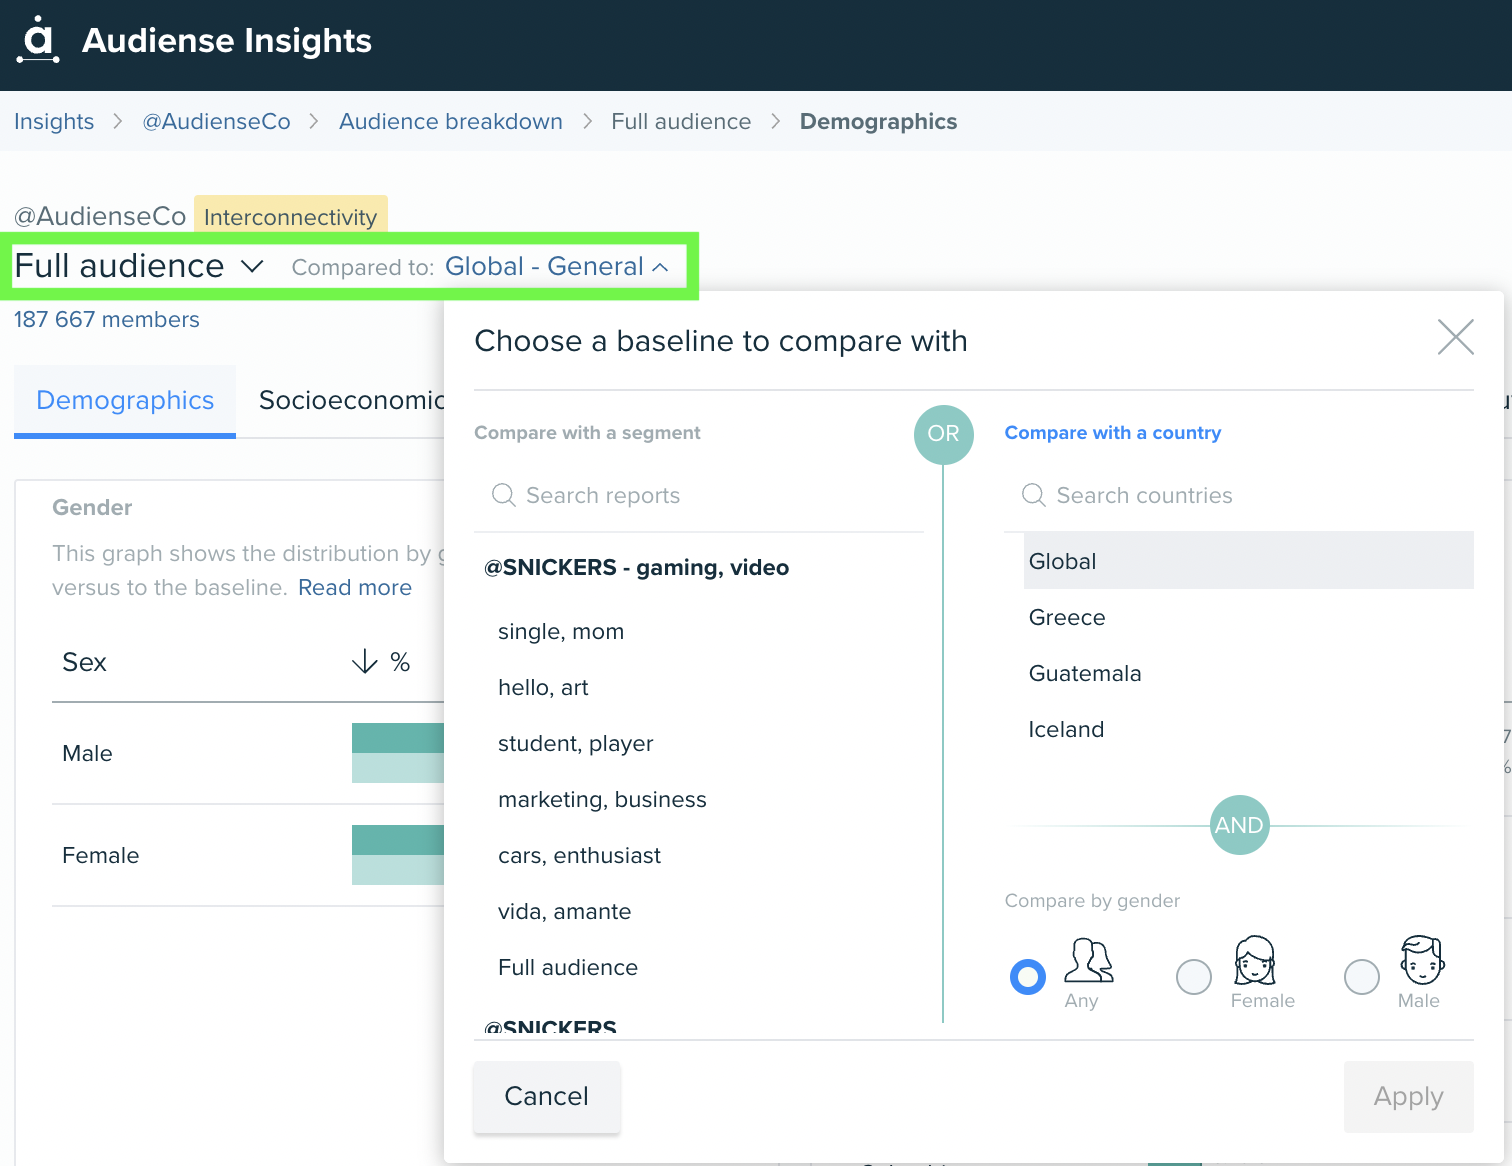
In the top left of the report, you will find the selection drop-down to switch between your primary audience/segment, and the baseline that it is compared too. This appears through-out the report, making it instantly accessible to switch between views. The baseline could be a country (already provided in your account), to which you can also apply gender filtering; for example, you could compare your audience to the female UK population. Or, you might choose the baseline to be a segment from a different report that you have already generated in your dashboard.
Every time you create an Insights report, the full audience analysed and the segments identified automatically become baselines you can choose from. You can find these on the left hand side of the baselines menu.
Read more about the baseline selector of insights report here.