In this article,
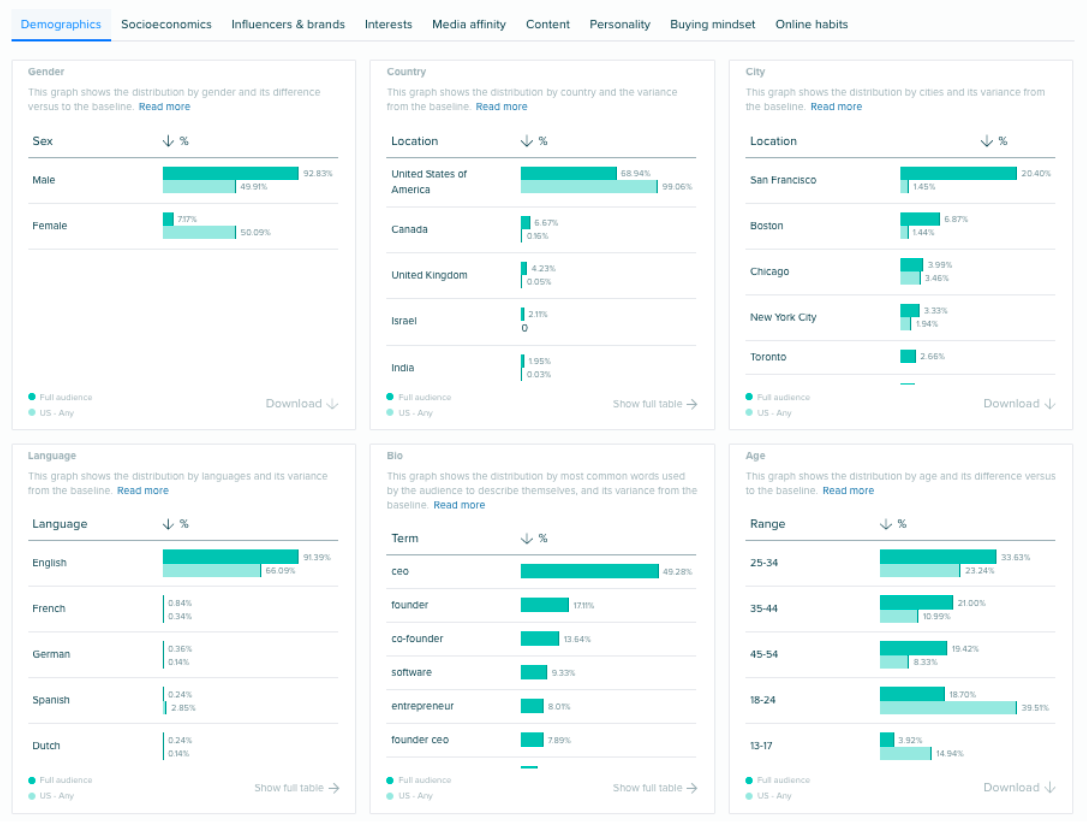
This tab shows you a number of different demographic insights compared to the baseline. The graphs you will see around demographics are the following:
- Gender – distribution by gender and its difference versus the baseline.
- Country – distribution by country and the variance from the baseline (we show the top countries where the audience is located in our demographics tab inside an insights report).
- City – distribution by cities and its variance from the baseline (we show the top cities where the audience is located in our demographics tab inside an insights report).
- Language – distribution by languages and its variance from the baseline.
- Bio – distribution by most common words used by the audience to describe themselves, and its variance from the baseline.
- Age – distribution by age and its comparison to the baseline.
- Location – distribution by country of the audience/segment
- Name – distribution by most common names within the audience, and its comparison to the baseline.
We use X's public profile information and our algorithm to infer information that X does not provide:
- Language is based on user posts.
- Country and city are inferred from their X profile, but we apply our algorithms to detect these correctly, as X profile location fields are free text and sometimes users apply different versions for a location.
- Age & Gender are not provided by X; we use our internal algorithms (AI).
Audiense infers the age & gender of the audience according to the interactions (tweets, follows, likes, clicks, etc.), the information in the profiles of the users (name, profile photo, time zone, location), other public information (demographic census) or combinations of these.
Calculating age:
Methodology
Theoretical foundations
Our new age enrichment is based on a set of machine learning solutions that leverages facial detection, facial recognition and age prediction based on a picture. Broadly, the current process iterates through a set of X user-profiles and has as a final goal to infer the age of each user based on the avatar provided in the profile.
Enrichment process
The enrichment process constantly iterates through our user set and examines the avatars of users to infer the age range based on the avatar content (their profile picture).
Not all users have a valid avatar for this enrichment, so we keep track of the last time we found a user and the avatar that the user had configured:
- A valid picture of a recognizable, single face will yield a valid result.
- Default avatars, illustrations, multi face pictures, logos, etc are not suitable for inferences.
When a user changes their avatar, a new inference will be obtained.
On the other hand, when we identify the avatar has not changed in a year, their age is increased by one year.
Note: bear in mind that users sometimes use fake pictures such as celebrities they are fans of, or pictures of their children, for example, which will have an impact on the age inference.
Estimating Gender:
Methodology
Theoretical foundations
Our gender enrichment process is based on a name-matching system that leverages a large database of first names, each statistically associated with a specific gender. The process analyzes the display name on a user’s X (formerly Twitter) profile and aims to infer the likely gender of the individual.
Enrichment process
As part of our ongoing enrichment workflow, we continuously analyze profile names to classify users into one of the following categories based on the match:
-
A name that clearly maps to a known male or female name results in a Male (M) or Female (F) classification.
-
Ambiguous or gender-neutral names (e.g., “Alex”, “Jordan”) are classified as Undetermined (U).
-
Names that do not appear in our database—such as brand names, emojis, or fictional characters—are left unclassified.
💡 This name-based gender classification also informs our account-level categorization:
-
If a name yields a result (M, F, or U), the profile is considered to represent an individual.
-
If no name-based inference can be made, the profile is more likely associated with a brand or organization.
The current enrichment process enables gender classification for over 95% of the user profiles in our system.