What is audience clustering (Segmentation), and why is it so important?
Audience clustering helps you uncover meaningful subgroups within a broader audience. Instead of treating your audience as one block, segmentation helps you understand the unique interests, behaviors, or relationships within it.
Understanding the difference between clustering and filtering is crucial, as often get misunderstood:
-
Clustering (Segmentation) = Unbiased, data-driven grouping based on observed behaviors or relationships.
-
Filtering = Pre-defining an audience using specific criteria like location, bios, followers, etc.
At Audiense, the starting point for any analysis is the audience you define based on criteria you choose—such as people in a specific location or those following certain accounts.
Once that audience is defined, clustering allows you to go deeper, uncovering distinct sub-groups within it. These clusters reveal niche insights about each group’s interests or behaviors.
This deeper understanding helps you:
-
Tailor and optimize your content for better engagement
-
Improve campaign ROI
-
Enhance lead generation efforts
-
Discover new market opportunities
Methodology Overview: How Audiense Clusters Audiences
Audiense offers two segmentation types, depending on whether you want to focus on connections between people or their interests:
| Segmentation Type | What it’s based on | Algorithm | When to use it |
|---|---|---|---|
| Interconnections | Relationships: “Who follows whom” within the audience | Louvain (community detection) | To reveal natural communities, professional networks, or local clusters |
| Affinities | Interest patterns: “Who follows similar accounts” | K-means (behavioral similarity) | For brand personas, fandoms, or interest-based groups |
Individuals can only be members of one cluster. So once the pattern of multiple clusters has been observed, each individual within an audience is assigned to the closest matching cluster. These methods identify naturally occurring clusters within your audience without bias.
1. Interconnections (Louvain Clustering)
This method identifies communities based on how people in the audience are connected to each other.
-
Focus: Network structure — Who engages with or follows whom?
-
Clustering logic: People are grouped based on mutual relationships.
-
Visual output: Each node = an audience member. Edges = follower/followed connections inside the audience.
Interconnections clusters individuals based on "who knows who," i.e., how these individuals are interconnected, using the Louvain algorithm which is based on relationships (communities). This method looks at who engages with whom and clusters them together. For instance, if person 'A' follows person 'B', they’ll be clustered together. This helps to understand the personas of associated people who are connected due to mutual relationships.
Best For:
-
-
Detecting tight-knit groups
-
Local or niche audiences
- Finding viral group potential
-
-
- Both B2C and B2B contexts, as it can break down markets into manageable clusters
- Professional cohort discovery
- Understanding influence flow within a market
- Both B2C and B2B contexts, as it can break down markets into manageable clusters
Technical details:
-
Algorithm: Louvain method
-
Clusters: Automatically defined (4–10 by default, up to 20 on request manually)
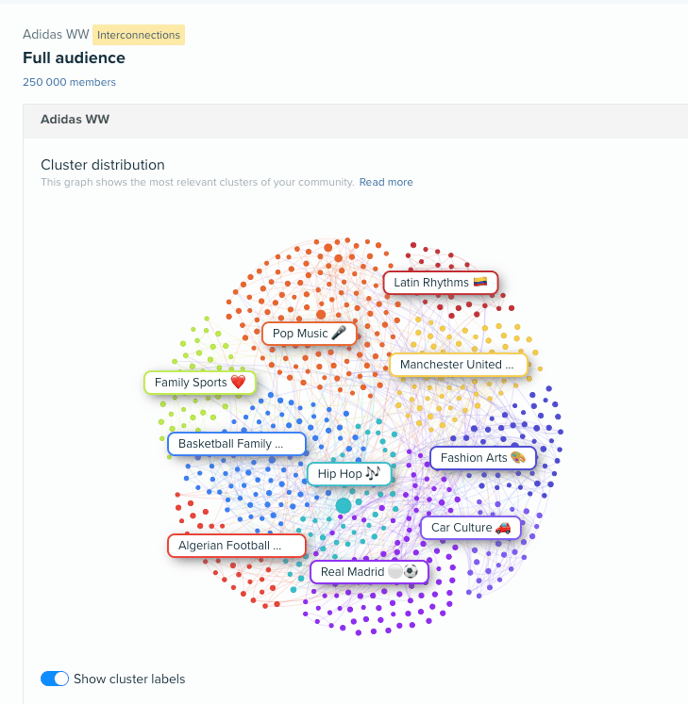
How to Interpret the Cluster Graph
- Cluster Size: The size of each cluster in the graph is proportional to the number of members it contains. Larger clusters indicate a higher number of members.
- Edges (Links/Lines): These represent the connections between nodes. For example, in the Interconnections graph, the edges show follows exclusively among audience members.
- Interconnections Graph: Nodes represent audience members, and all connections (edges) are exclusively between them. This graph visualizes how members of the audience are connected to one another.
- Node Size: The size of each node corresponds to the number of connections it has. Larger nodes have more connections. Hovering over a cluster in the interface highlights the connections for that cluster.
2. Affinities (K-means Clustering)
This method clusters audience members based on similarity in interests, using what accounts they follow as behavioral signals.
-
Focus: Shared interests - even if people aren’t directly connected.
-
Clustering logic: Groups users who follow overlapping sets of accounts, reflecting common interests or behaviors.
-
Visual output: Nodes = people and influencers they follow. Edges = interest similarity links.
Affinities provides unsupervised clustering, which breaks users out into clusters based on their unbiased interest behaviors due to their following patterns. Individual users are grouped into a single best cluster based on the handles they choose to connect with.
This clustering method uses the K-means algorithm. It is useful for grouping items based on similar properties, instead of relationships. The main goal of this algorithm is to cluster data into several groups based on similarity.
Once the algorithm detects a group of users with a pattern of following a handful of the same accounts, that group becomes the signal for a particular cluster.
Best For:
-
- Segmenting audiences by brand affinities
- Identifying fandoms or passion points
-
Partnerships or media planning
-
Exploring larger global audiences to understand broader consumer media strategies
Technical details:
-
Algorithm: K-means
-
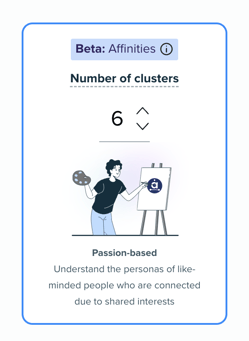
Choose between 2 and 20 clusters, depending on granularity
This method lets you select the desired granularity for uncovering hidden clusters. You can adjust between 2–20 clusters, or go with the recommended number based on the estimated size of your audience. Select fewer clusters to break out high-level clusters, or more clusters to uncover niche segments.

How to Interpret the Cluster Graph
- Cluster Size: The size of each cluster in the graph is proportional to the number of members it contains. Larger clusters indicate a higher number of members.
- Affinities Graph: Nodes represent both audience members and influencers. Edges indicate connections not only between audience members but also between audience members and influencers.
- Node Size: The size of each node corresponds to the number of connections it has. Larger nodes have more connections. Hovering over a cluster in the interface highlights the connections for that cluster.
How to access and use Audience Segmentation?
-
Free Insights & X Marketing plans → Interconnections only (limited insights).
-
Audiense Insights plan → Both methods available.
- After defining your audience, select Interconnections or Affinities as your segmentation method.
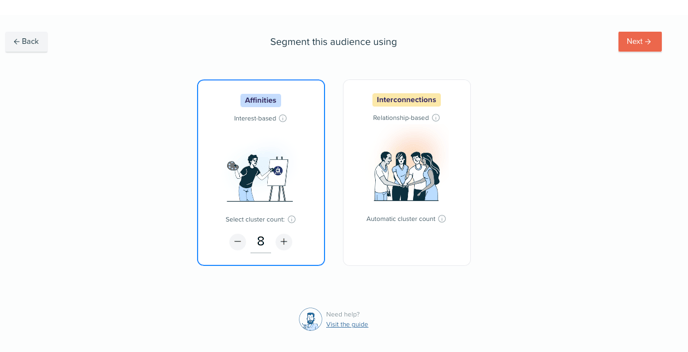
If you select Affinities, choose the desired number of clusters between 2 and 20 to tailor the analysis according to your requirements, or opt for the recommended number of clusters, which is based on the estimated size of your audience, and launch your Insights report
For Interconnections, you won’t be able to choose the number of clusters, as we will deliver only those that are connected within the audience, which can result in 4 to 10 by default, but you can manually select and request additional clusters, up to 20.
Summary: Choosing the Right Segmentation
| Use Case | Best Method |
|---|---|
| Discovering niche local groups or professional communities | Interconnections |
| Building interest-based personas for media or influencer strategy | Affinities |
| You want the platform to auto-detect tight communities | Interconnections |
| You want to control the level of segmentation granularity | Affinities |
Learn more about our Audience Breakdown Page (incl. cluster summaries, renaming clusters, merging clusters, and more).