You can integrate your social listening tool with Audiense to send your listening export straight to the Insights dashboard, at a click of a button. However, if you haven’t done this yet, there is also a manual method to upload your audience to Audiense Insights and run an Intelligence report.
First, you need to export your authors of the conversation (filter by X - you will get an export with many columns, including X @authors and X IDs - you only need one or the other)
From your social listening export, you should copy & paste your X Authors (@handles) or X IDs into a separate sheet and convert this to a TXT (text only file), but make sure there are no titles or any other data but these authors or ID numbers.Follow these simple steps:
- Go to Create new report from your Insights dashboard
- Give your report a name
- Choose the audience report type, “Upload your audience” and click Next

The export from your social listening tool will most likely come as a CSV file. So first things first, let’s get your CSV file ready:
- File needs to contain only 1 column with the list of X author handles or IDs, one item per line. There are many ways to do this:
- Delete the rest of the data from the document, remove all other columns and rows
- Simply copy and paste the IDs or author handles into a new sheet (no column titles)
- Copy/paste the author handles or X IDs (no column titles or spaces) straight into a tool such as TextEdit.
- File needs to contain at least 100 individual IDs or handles and a maximum of 1M. This means no duplicates. (*You can easily remove duplicates on Excel by selecting the cells, then clicking on Data> Remove duplicates)
- Save the file as UTF Unicode Text (.txt)
- Drag or upload your file by clicking on the arrow (see screen below).

5. Click Next
6. Choose Segmentation type (Affinities or Interconnections)
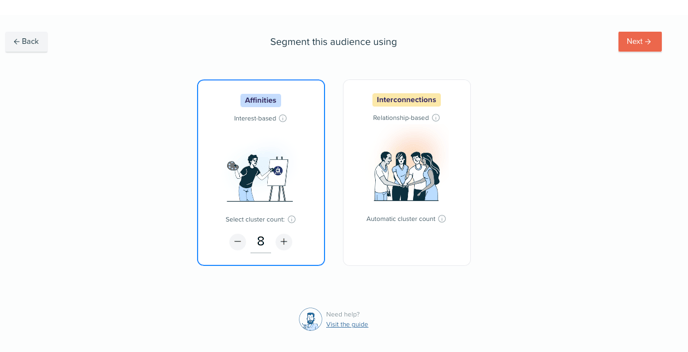
7. Click Next to launch your report
Result
Easy to integrate data from other platforms and elevate it by having a better understanding of people who are talking about the topics relevant to your brand.
