Tweet Analytics enables you to visualise the effectiveness of your Tweets in terms of likes, replies and Retweets. See which Tweets were more successful and take measures to improve the effectiveness of future engagement.
Note: Users with a Free plan do not have access to this function. Users with a Twitter Marketing plan or an Audience Insights plan will have access.
1. Select Tweet Analytics from the analytics drop-down menu on the top menu bar.
2. The Tweet Analytics dashboard opens.
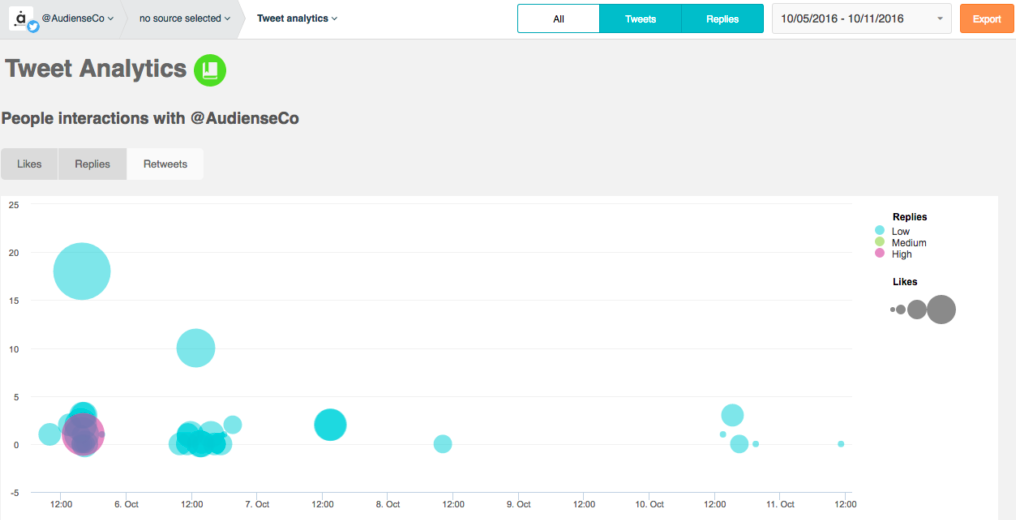
On the breadcrumb bar you can choose to view all Tweets, Tweets, or just replies. Use the calendar to modify the timespan of the information and click export to export to Excel.
The dashboard has various panels:
- People interactions
- Engagement stats
- Engagement rates
- My actions
- Tweet listing
People interactions – A graph in which each circle represents a Tweet.
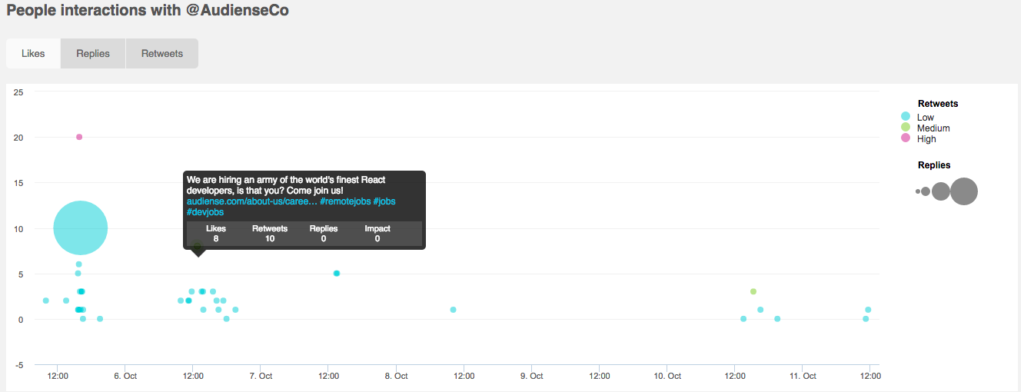
Mouseover any of the circles to see more detailed information:
- Tweet text
- likes
- Retweets
- replies
- impact – The difference in the number of followers five minutes after the Tweet.
The X-axis shows the timespan. The Y-axis data is variable and shows the number of likes, replies or Retweetsdepending which is selected. The key to the right of the graph shows what the size and colour of the circles represent.
If you select likes for the Y-axis:
- The higher the circle, the more likes the Tweet received.
- The colour of the circle shows how many Retweets the Tweet received.
- The bigger the circle is the more replies the Tweet received.
If you select replies for the Y-axis:
- The higher the circle, the more replies the Tweet received.
- The colour of the circle shows how many likes the Tweet received.
- The bigger the circle is the more Retweets the Tweet received.
If you select Retweets for the Y-axis:
- The higher the circle, the more Retweets the Tweet received.
- The colour of the circle shows how many replies the Tweet received.
- The bigger the circle is the more likes the Tweet received.
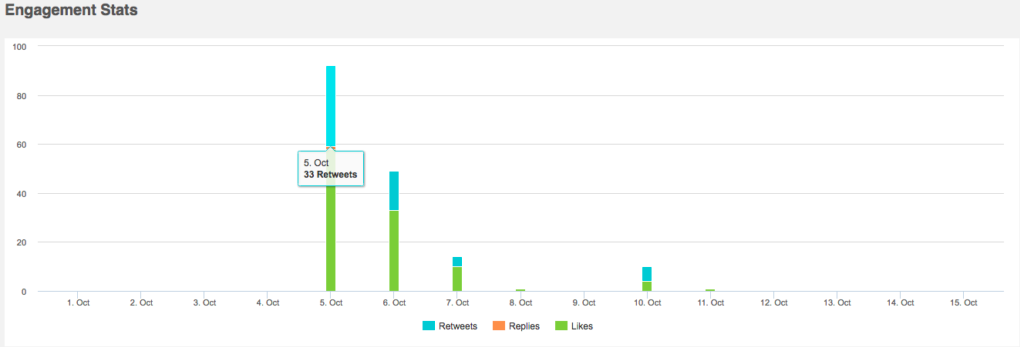
Engagement stats – Click any combination of the Retweets, replies and likes icons below the chart to see those metrics on the chart.
Engagement rates – This panel shows some social media metrics which give you an idea of how you are performing on Twitter.
- Amplification rate – The number of Retweets you received per Tweet. It measures how much your audience values your content enough to share it with their own Twitter communities.
- Calculated by Retweets / (Tweets + replies + mentions).
- Conversation rate – The number of mentions you received per Tweet. It checks that you understand who your audience is and as a result post appropriate content which results in conversations.
- Calculated by (mentions + replies) / Tweets.
- Applause rate – The number of likes you received per Tweet. It is a measure of how valuable your community finds your Tweets and as a result likes the Tweet.
- Calculated by likes / (Tweets + replies + mentions).
- Lists – The number of lists you have been added to in the time period.
- Clicks – The number of clicks your Bitly links have received. Connect your Bitly account to your Audiense account from settings on the top menu bar.
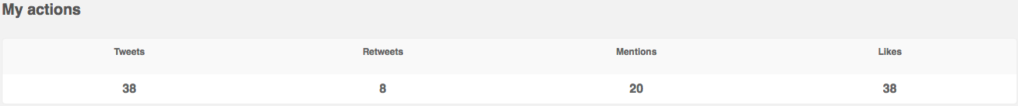
My actions – This panel shows you the number of Tweets you have sent, how many Tweets you have Retweeted or liked, and how many mentions you’ve given or received.
Tweet listing – Your Tweets are displayed in a chronological list view.
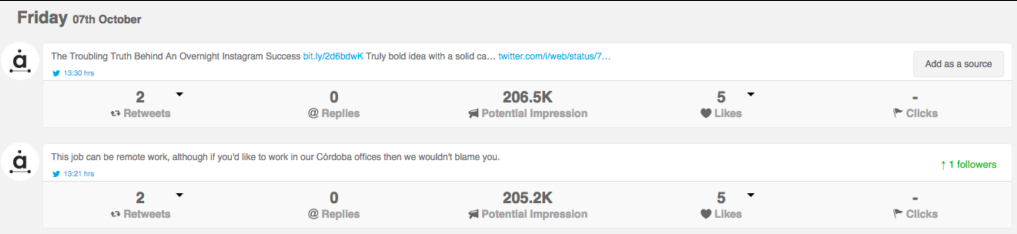
See the number of Retweets, replies, likes and clicks each Tweet received. See a Tweet’s potential audience, which is calculated by the number of followers that the users who Retweeted you have, plus your own followers. The impact(the change in the number of followers five minutes after the Tweet) is shown in the top right corner for each Tweet (green for positive impact and red for negative).
Click on Retweets, replies, or likes to see the users who engaged with your Tweet. Click the @username to open the user details sidebar where you can carry out many typical community actions.
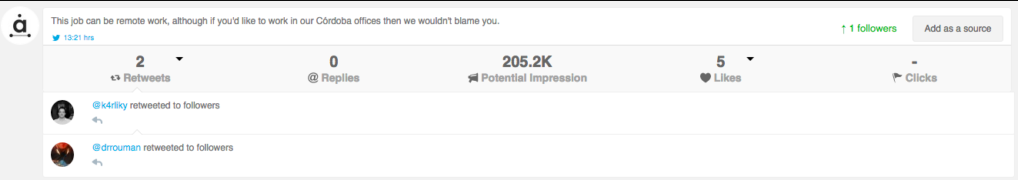
You can reply to the users who engaged with the Tweet. Click the reply arrow below the username to open the Tweet Editor.
To add the Tweet as a source mouseover the Tweet and click the emerging add as a source button in the top right. You can continue to monitor the Tweet as the source is updated after synchronisation. The source appears on your homepage in the Source: Discover Retweeters section.
Notes
Tweet Analytics is a real-time feature and does not depend on your account being synchronised.
Audiense distinguishes between a reply and a mention. A reply is a response to a Tweet that begins with the @username of the person you’re replying to. A mention is a Tweet that contains a @username anywhere in the body of the Tweet. However, on Twitter, replies are also considered mentions.
- Discrepancy between info in Tweet Analytics and info on the dashboard
The dashboard reflects any ‘events’ which have occurred in the time period selected. For example, in this time period you may have received a like of a Tweet which you posted two years ago. Tweet Analytics, on the other hand, is based only on the Tweets of the selected period and the ‘events’ that these specific Tweets generate. For this reason you may notice fewer likes, Retweets, replies, etc in Tweet Analytics than you see on the dashboard.
- Discrepancy between info in Twitter Analytics and info in Audiense Tweet Analytics
There may be some differences between the info you see on Twitter and the info presented in Tweet Analytics. This is because we don’t use exactly the same criteria as Twitter to calculate our data. For example, Audiense groups replies and mentions separately, so you may see that we show two Tweets, one reply and one mention while Twitter shows four Tweets. It’s normal that there are slight discrepancies between the two platforms