But, let us take a deeper look into how it’s done. Here is a more transparent explanation of how we calculate this tab, and the different factors involved in obtaining the insights.
For context, we use Meta population as census data. From the Meta Ads API, we receive data on these socioeconomic areas:
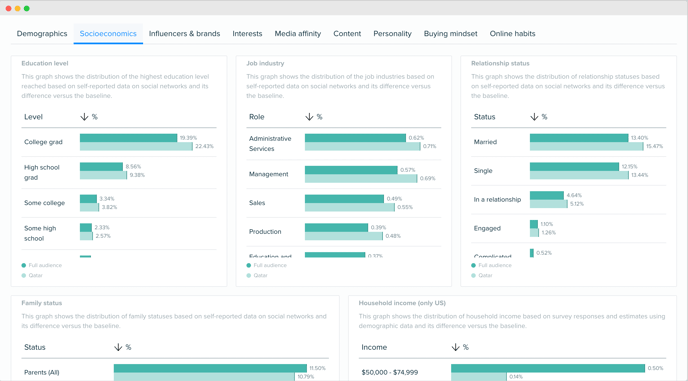
- education level
- industries
- relationship status
- family status
- household income (only US)
To further clarify and differentiate the data in an audience from other segments/baselines, we follow a process. Using the demographic traits of age, gender, and country, we divide the audience into their groups.
For example:
- US women aged 18-24
- US men aged 18-24
- US women aged 25-34
- UK men aged 18-24
and so forth.
Then, we weigh each group, to find what percentage of space they hold within the audience. Next, we retrieve the socioeconomic data for each of those groups. From there, we make a final calculation based on the groups’ socio-economics and their weight distributions, to form the final solution which creates the socioeconomic data that you see in our platform!
For example, if we found an audience with 86% women from the US who are aged between 18-24, and then 14% men from the US, aged between 18-24, we would then weigh the socio-economic findings based on the combined gender, age and country distribution that the group represents within our audience. This method means that smaller audience groups aren’t excluded, but are represented fairly.
The list of countries that we have insights available include the following:
United States of America, Great Britain, Spain, Mexico, Canada, Ecuador, France, Germany, Italy, Japan, Australia, Argentina, Brazil, Columbia, Ukraine, South Africa, Sweden, China, India, Turkey, Russia, Kazakhstan, Estonia, Lithuania, Latvia, Georgia, Armenia, Belarus, Uzbekistan, Iraq, Libya, Tunisia, Morocco, Somalia, Keyna, Peru, United Arab Emirates, Chile.
If we cannot find socioeconomic data for a country, then we fall back to global (or worldwide).
Please note:
Household Income only takes into account audience members who are known to be in US.
This Household Income (US only) data comes from Meta, so we cannot always get data for the full audience, as it depends on the distribution of this audience and data we have available for them. There could be people we don't know the range for, or that aren't in any of these ranges, i.e. less than $40K. The data in Socioeconomics (Household Income) would not add up to 100%.
Why are the Socioeconomics the same as the baseline/across all segments?
As a result of what we have previously explained, the chance of the baselines matching across segments is very unlikely now. However, there might be a case where they are similar, simply because the audiences you are comparing have similar age, country and gender distribution.
Related article about the Socioeconomics tab of Insights reports.