In this section, we'll look at:
- Who's Engaging With You?
- Reviewing your Account Performance
Who's Engaging With You? (Intersection Report)
Audience Intersection Report is a great way to get a snapshot of the current performance of selected accounts, sources or monitoring queries. We can see the number of exclusive users and common users of each audience.
This is a great tool to find relationships between audiences. It is also beneficial as you can see how effective the social strategy of each audience is. In addition to this, you can see which accounts from similar sectors have a cross-over – are you sharing followers with a particular competitor or do you have a high number of exclusive users? And if your brand has a number of Twitter accounts, how big is your total community? For example, is there a proportion of people talking about you but not following you and if so, what is the size of the missed opportunity?
There are 3 main ways we use our intersection report:
- Brand health: Comparing our many Twitter handles to see if there is a cross-over between the accounts – what is the total size of our community?
- Understand who is talking about you or engaging in a specific campaign but not following you – the total size of our community could be bigger than we think
- To see where we share followers with a competitor
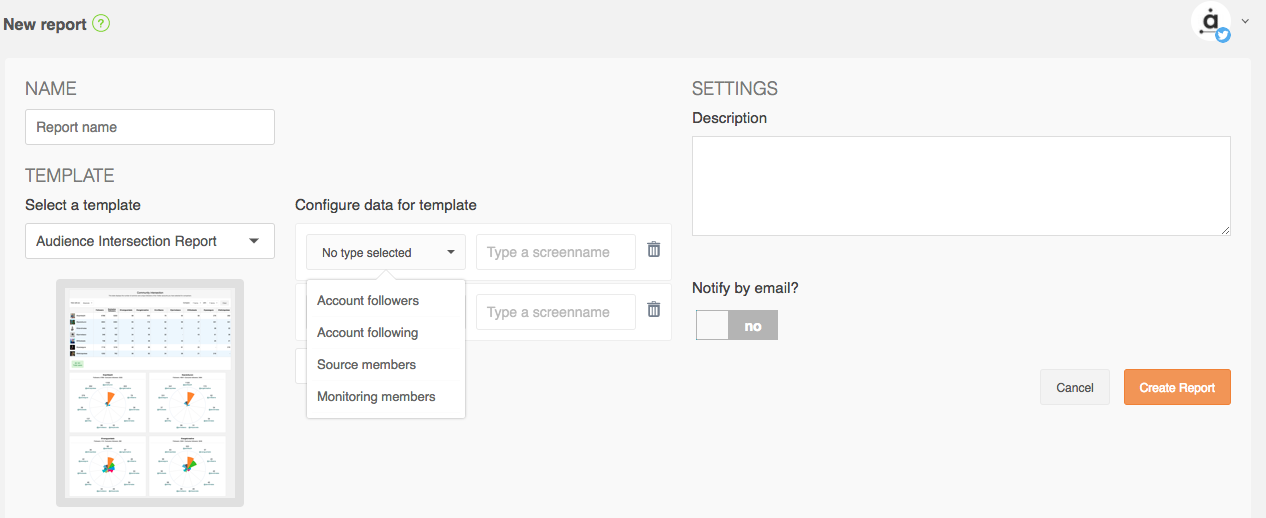
To create an Audiense Intersection Report, first, go to ‘Analytics’ in the top menu bar and select ‘Reports’ . This will bring up the Report Dashboard. In the top you’ll see a ‘Create new report’ box, simply click that to begin.

Give your report a name, then select the template, which will be the ‘Audience Intersection Report’. Here we add the accounts, sources (including audiences) or monitoring the report will be based on. You are able to add up to 20 accounts and sources here. Just click ‘Create Report’ to complete the report.
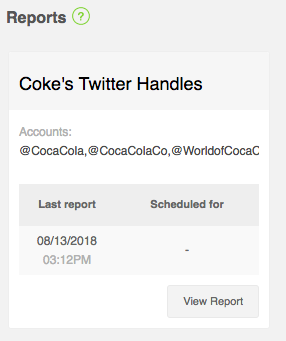
To view your report, go back to the Report Homepage and select the report you'd like to view.
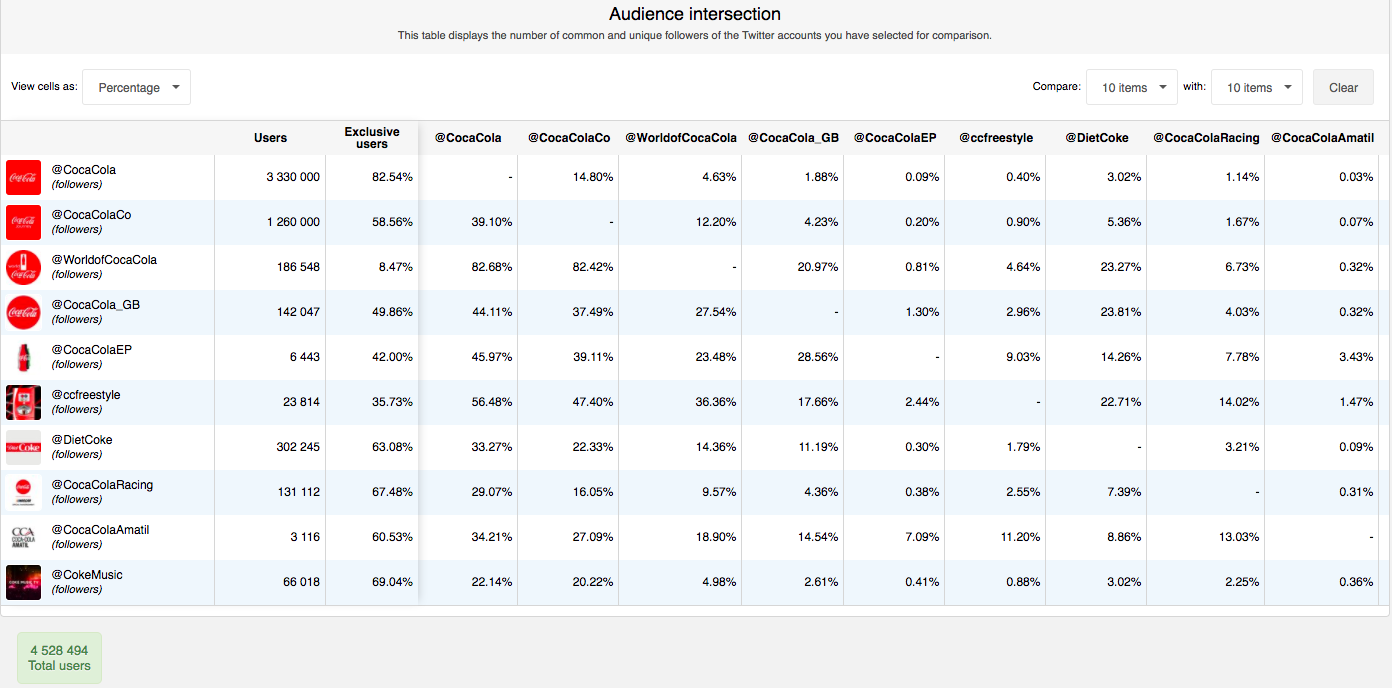
This will bring up the Report Dashboard. In this example, we're looking at which Coke handles share users, and how many. The first 2 columns states how many users each audience has, and how many of those users are exclusive to them. The rows show the number of users that each have in common with each other and below we have the total number of users - this means if a user follows more than one account, they’ll only be counted once. This is useful as it shows the total number of users in a community.
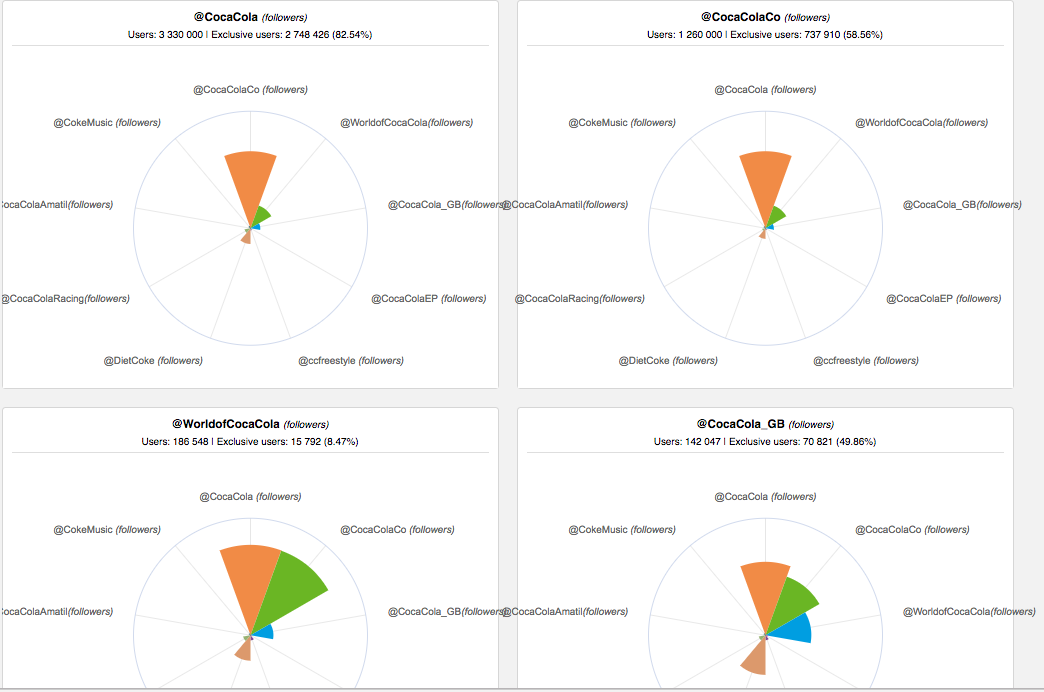
Underneath all this, we have polar area charts for each audience, which are broken down versions of this data.
Find more information about this topic here.
Reviewing your Account Performance (Profile Performance)
The Profile Performance Report provides an overview of the results you are achieving with your (owned) account, in terms of influencers, engagement, followers, etc. and lets you see the evolution over time.
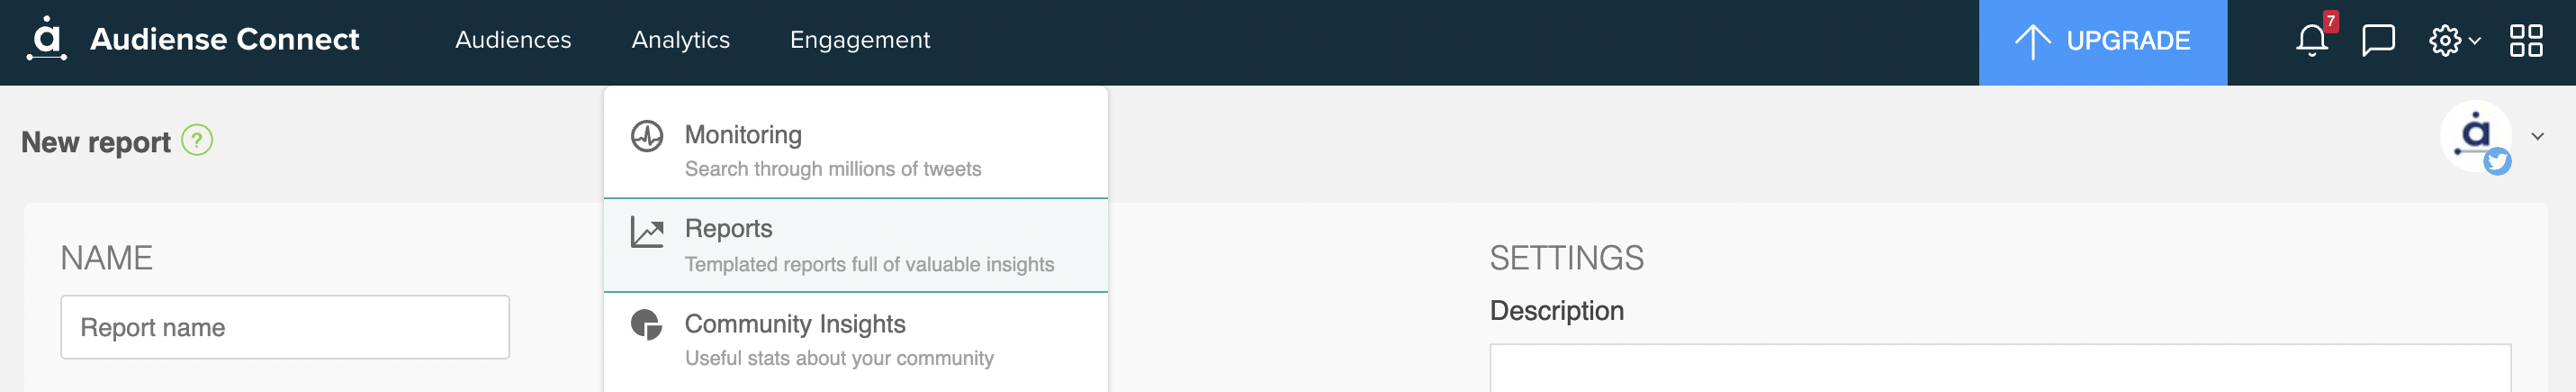
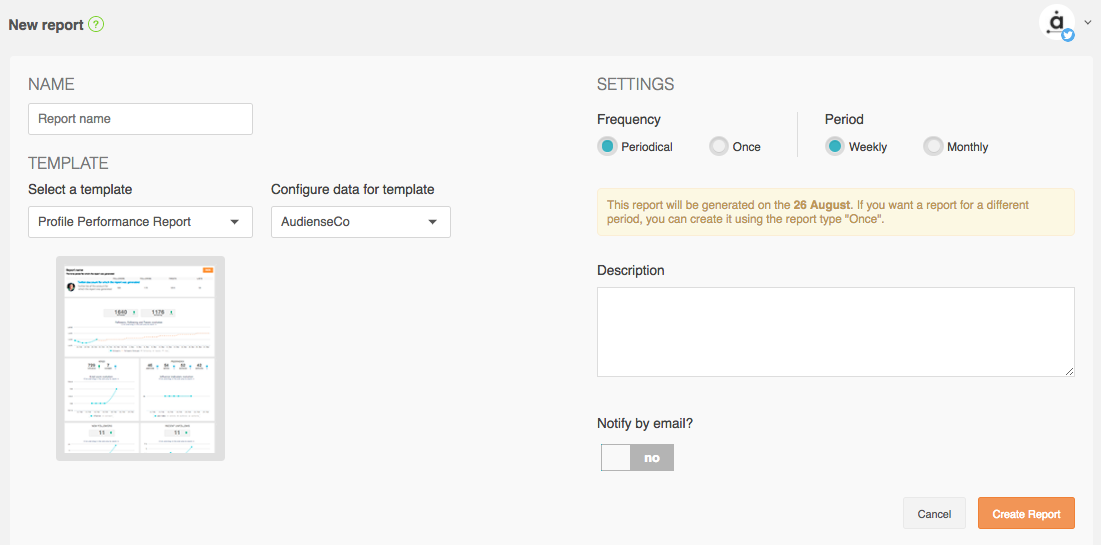
To create a Profile Performance Report, first, go to ‘Analytics’ in the top menu bar and select ‘Reports’. This will bring up the report dashboard. In the top you’ll see a ‘Create new report’ box, simply click that to begin. Give your report a name, then select the template, which will be the ‘Profile Performance Report’.
Give your report a name, select a name, and fill out the settings.
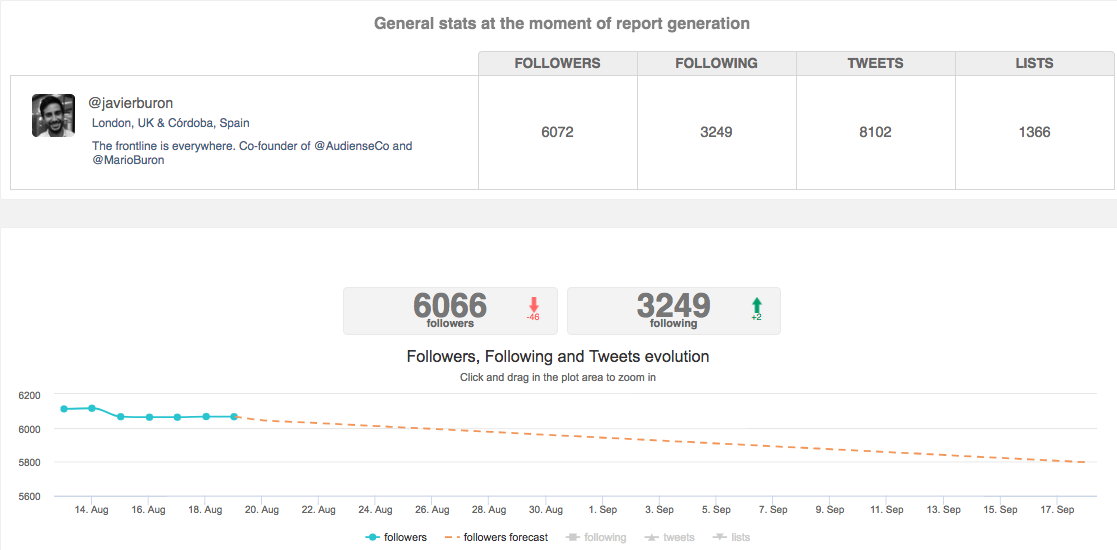
The first widget of this report will display a graph of the evolution of your account. Under this there are more graphs that break this down into specific sections such as followers, engagement and top tweets.
More information on Profile Performance can be found here.