We will go further and understand the intricacies of each segment: demographic insights, interests and affinities, content they engage with, and much more.
In the first summary page, click See all segments.
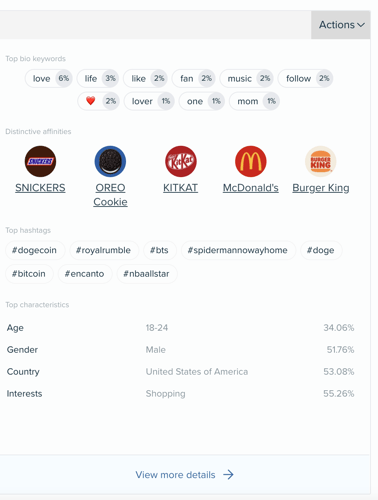
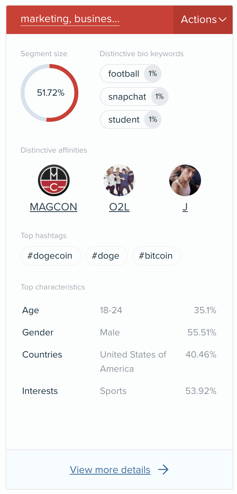
On the bottom of the full audience view, and each segment panel, you will find a clickable option ‘View more details’. That’s your way to discover detailed insights about the full audience or the segment selected.
You can see the insights applied and displayed across 9 different tabs.
- Demographics
- Socioeconomics
- Influencers & Brands
- Interests
- Media Affinity
- Content
- Personality
- Buying Mindset
- Online Habits
**Click on each tab to access the information associated with that category: Click on Read more to understand how to interpret each graph, how the insights are derived and an example of insight application.
Demographics
This report shows you a number of different demographic insights compared to the baseline. The graphs you we will see around demographics are the following:
- Gender
- Country
- City
- Language
- Bio (how they describe themselves - most popular words in their bios)
- Age - age ranges
- Location (Map)
- Name
Learn more about the Demographics tab here.
Socioeconomics
The graphs you will see around demographics are the following:
- Education Level
- Job Industry
- Relationship Status
- Family Status
- Household Income (US only)
Learn more about the Socioeconomics tab here.
Influencers & brands
In the interests tab we will find out more about the audience and/or its segments’ affinities. This area helps you to understand what/who the audience are interested in, through the use of filters and rankings. People follow accounts they have an interest in, and they engage with accounts that are relevant to them.
This graph shows the brands and individuals the audience members have a greater affinity towards (who they follow). The larger the affinity, the greater these brands and influencers' reach is within your audience (meaning more of your audience loves them!). You can use this information to find influencers, potential partnerships, and keep an eye on competitor brands. This information will be particularly useful in identifying the unique characteristics for re-naming your segments.

You are able to order the profiles by uniqueness or by affinity (default setting). If you select order by uniqueness the accounts are ordered based on our uniqueness algorithm in comparison to the baseline. If you select order by affinity the accounts are ordered based on the percentage of the audience which follow these accounts. You also have varying levels of uniqueness to use too.
You can create a profile groups, read more here.
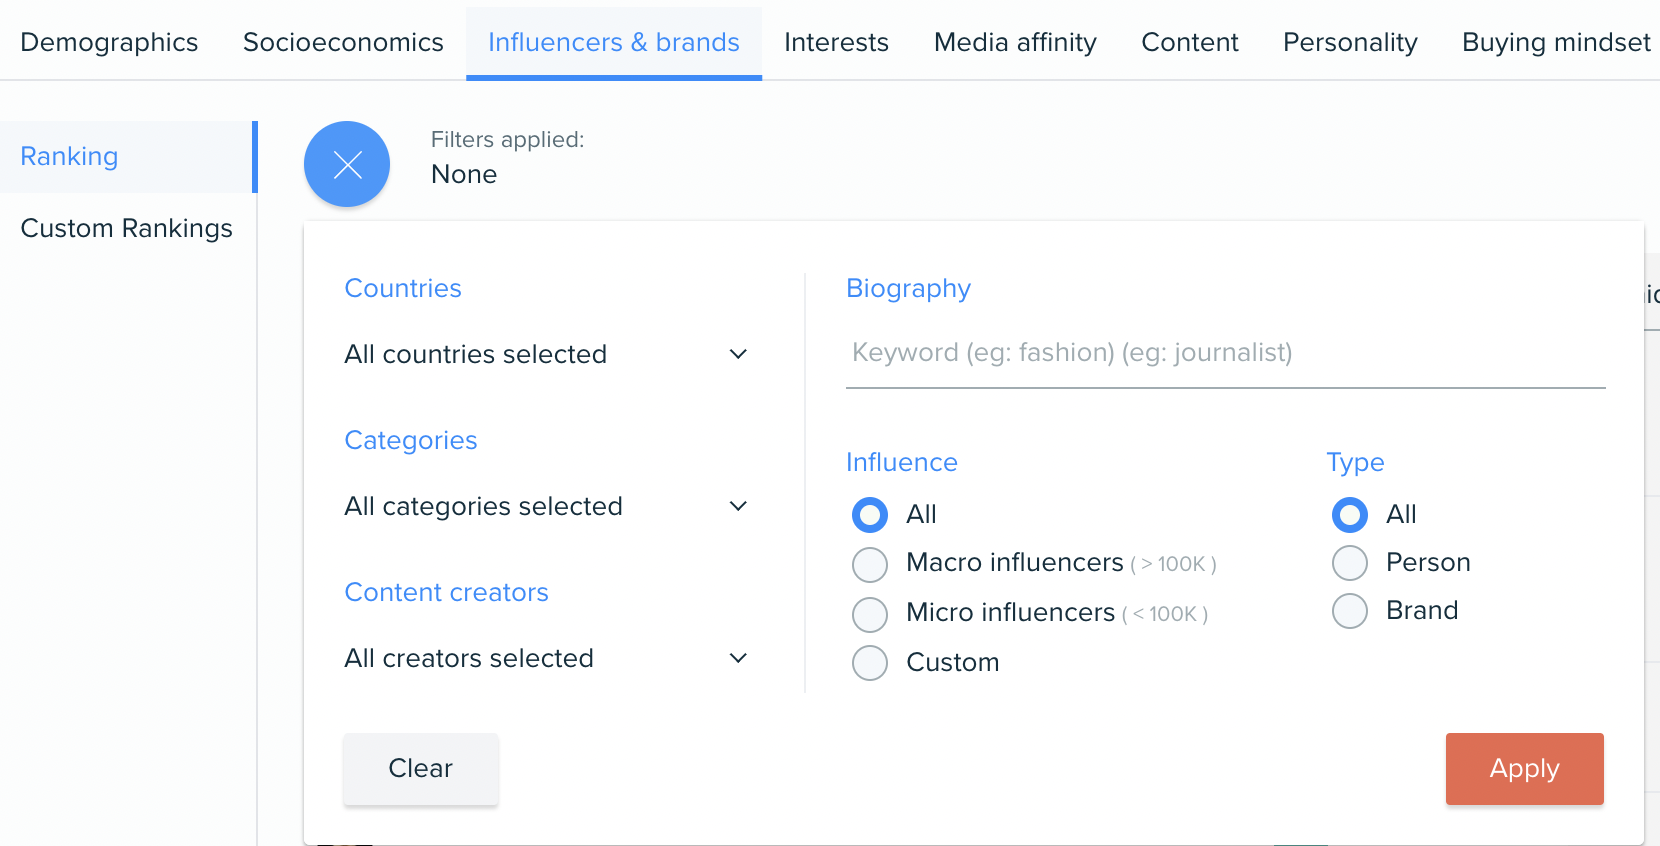
Paid users, are able to filter the Influencers and Brands by type of account, category, and more:
- Country - any country, including globally (all).
- Category - select from a range of categories, such as Finance, Healthcare, Politics or Magazines.
- Content creators - choose from LinkedIn, Tiktok, Youtube, and more.
- Biography - search for keywords, e.g. 'gmail' to find users publicly sharing their email, or 'journalist' for journalists.
- Influence - the number of followers, macro, micro, or your own custom input
- Type of account – this can be brands or individuals
For example: You may want to just see individuals in the fashion industry in order to find fashion influencers within your audience.
Paid users are able to export this list of accounts by clicking on the Actions drop-down menu, and export influencers into XLS, or add them as an audience in the Connect platform.
Learn more about the Influencers & brands tab here.
Interests
The Interests Category Tab determines the interests of an audience by amalgamating two primary signals: user-generated posts and followed content/accounts on X. These signals are clustered according to The Interactive Advertising Bureau (IAB) content taxonomy standards and guidelines, representing the percentage of the audience or segment interested in each category.
This graph offers quantitative interpretation, showcasing the weight of various interest categories within either a segment or the full audience. By comparing against a baseline, you can pinpoint the most pertinent insights for your audience.

Utilize the filter to identify interest categories related to a specific topic or explore interests around a particular theme. For instance, filtering by "Sports" allows users to focus solely on Sports-related interests within the analyzed audience, minimizing irrelevant noise.

Please note that the ranking always displays the absolute position of the interests, even when filters are applied.
You can read more about category interests and other functionality within that tab here
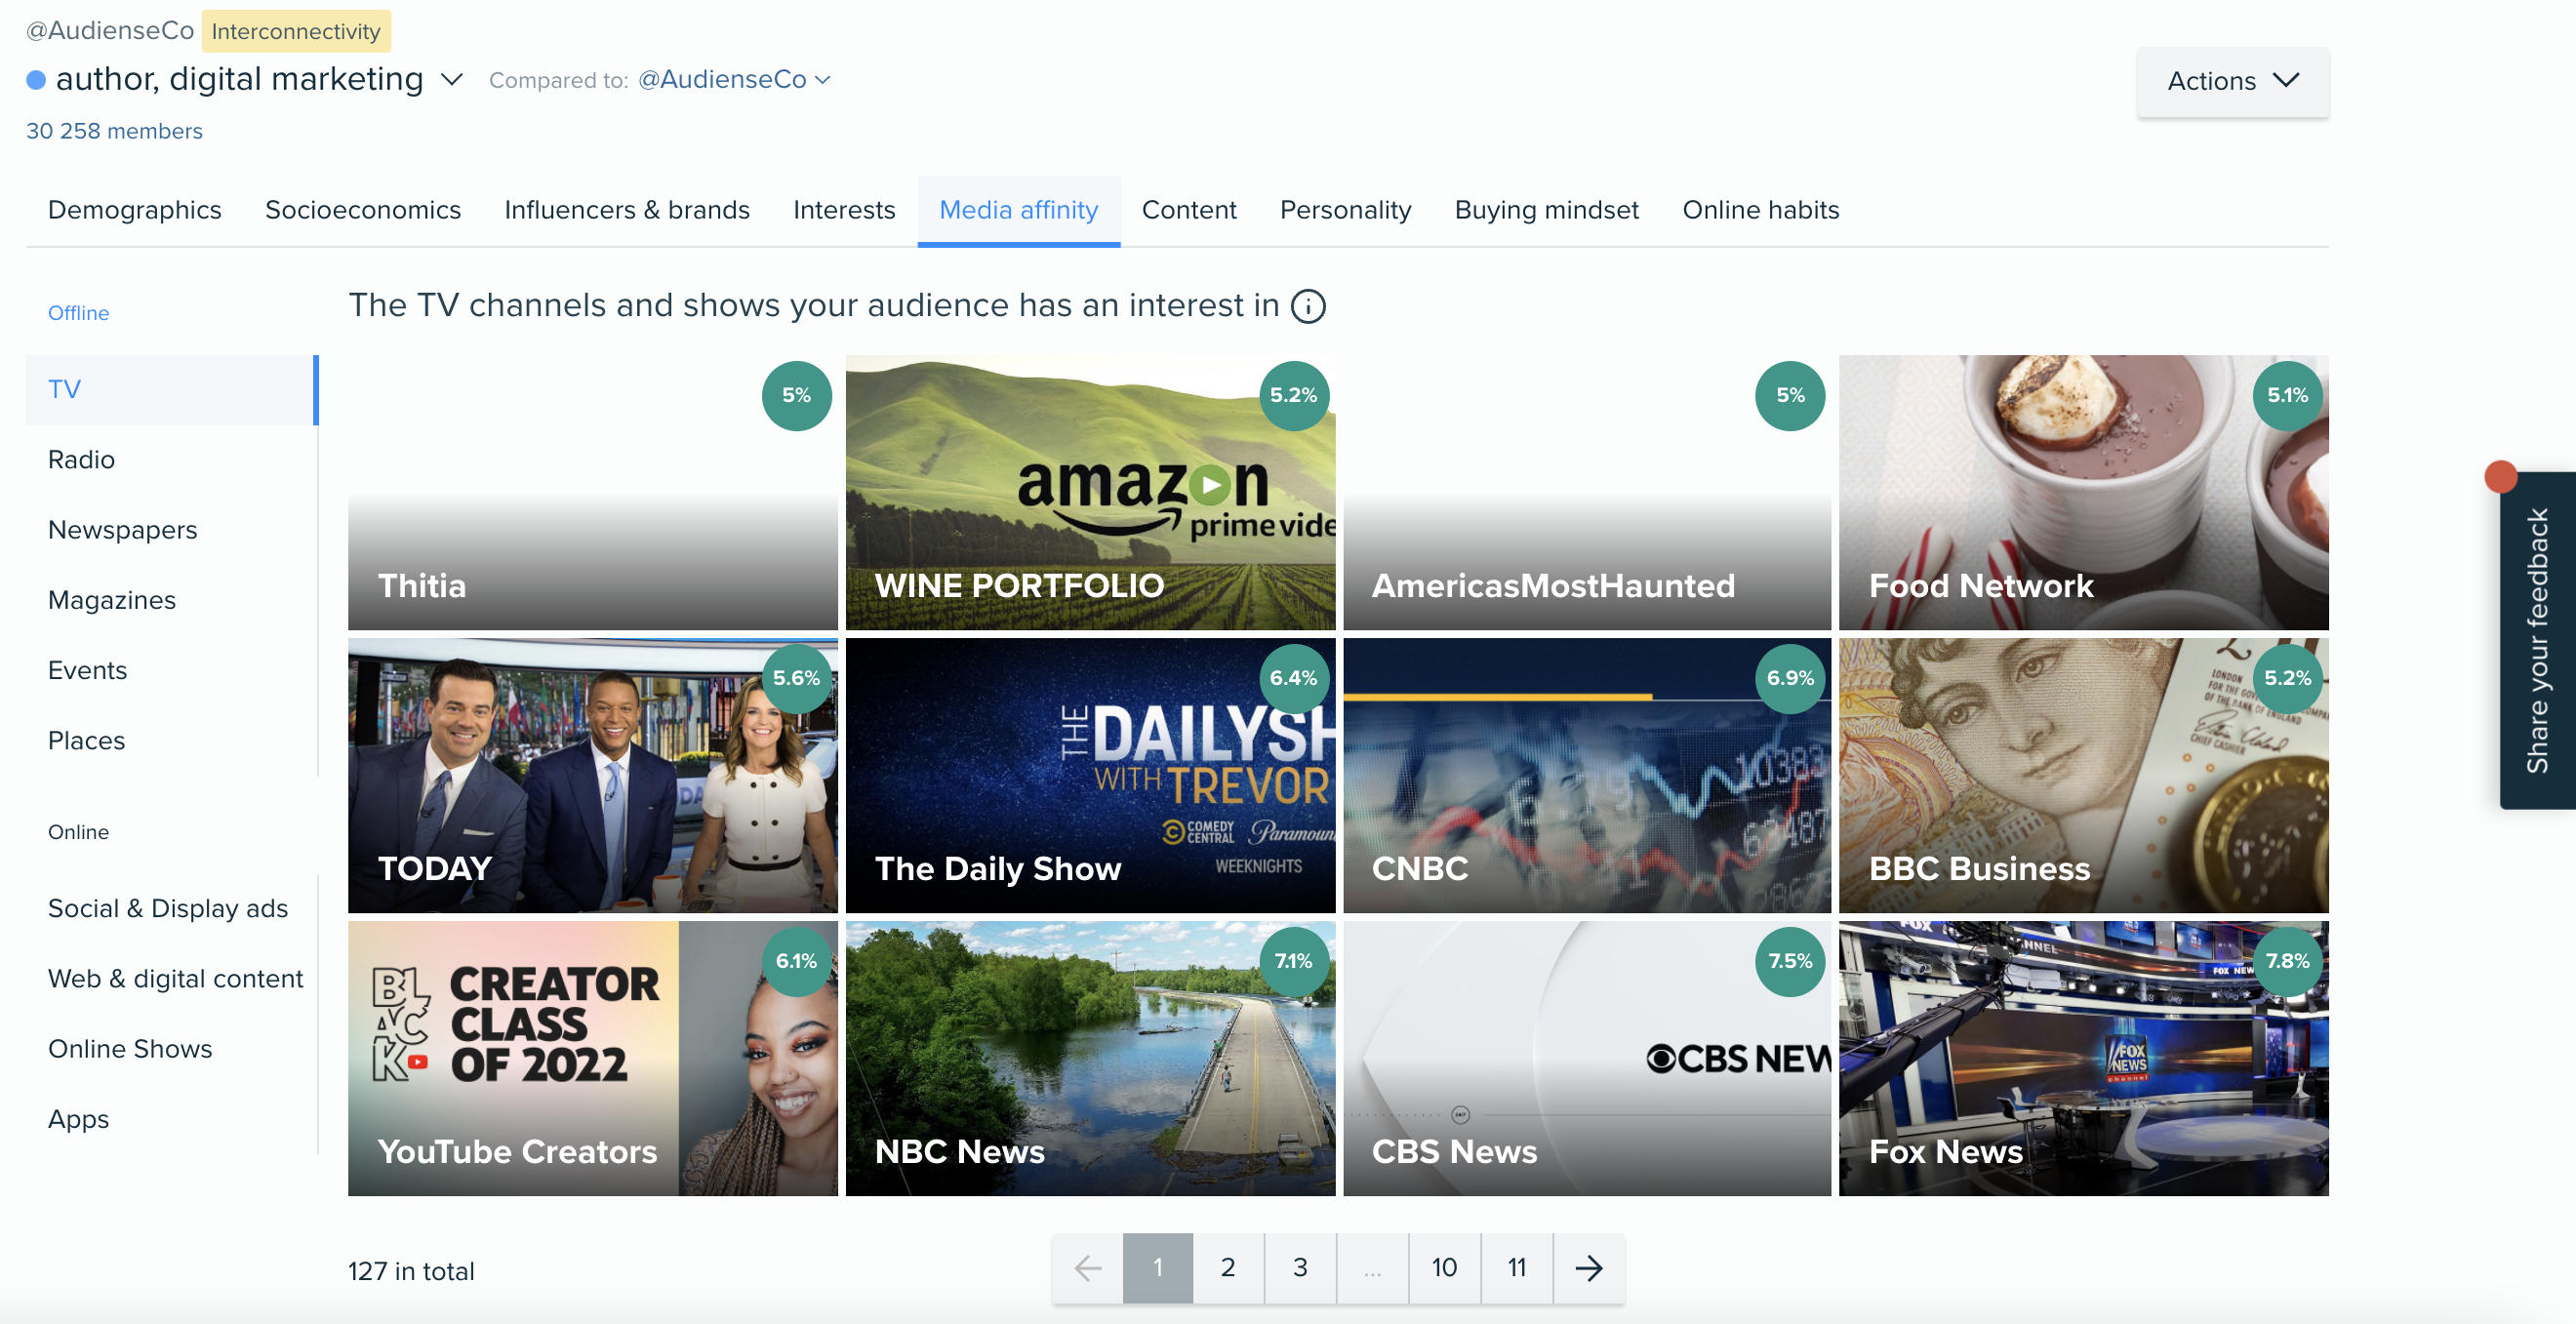
Media Affinity
This area works similarly to the Influencers & brands tab, but has already neatly categorised media outlets for you, including Offline outlets: TV, Radio, Newspapers, Magazines, Events, Places. As well as suggestions to target for Online: Social & Display Ads, Web & digital content, Online Shows, and Apps.
You can read more about this tab, and its areas in more detail here.
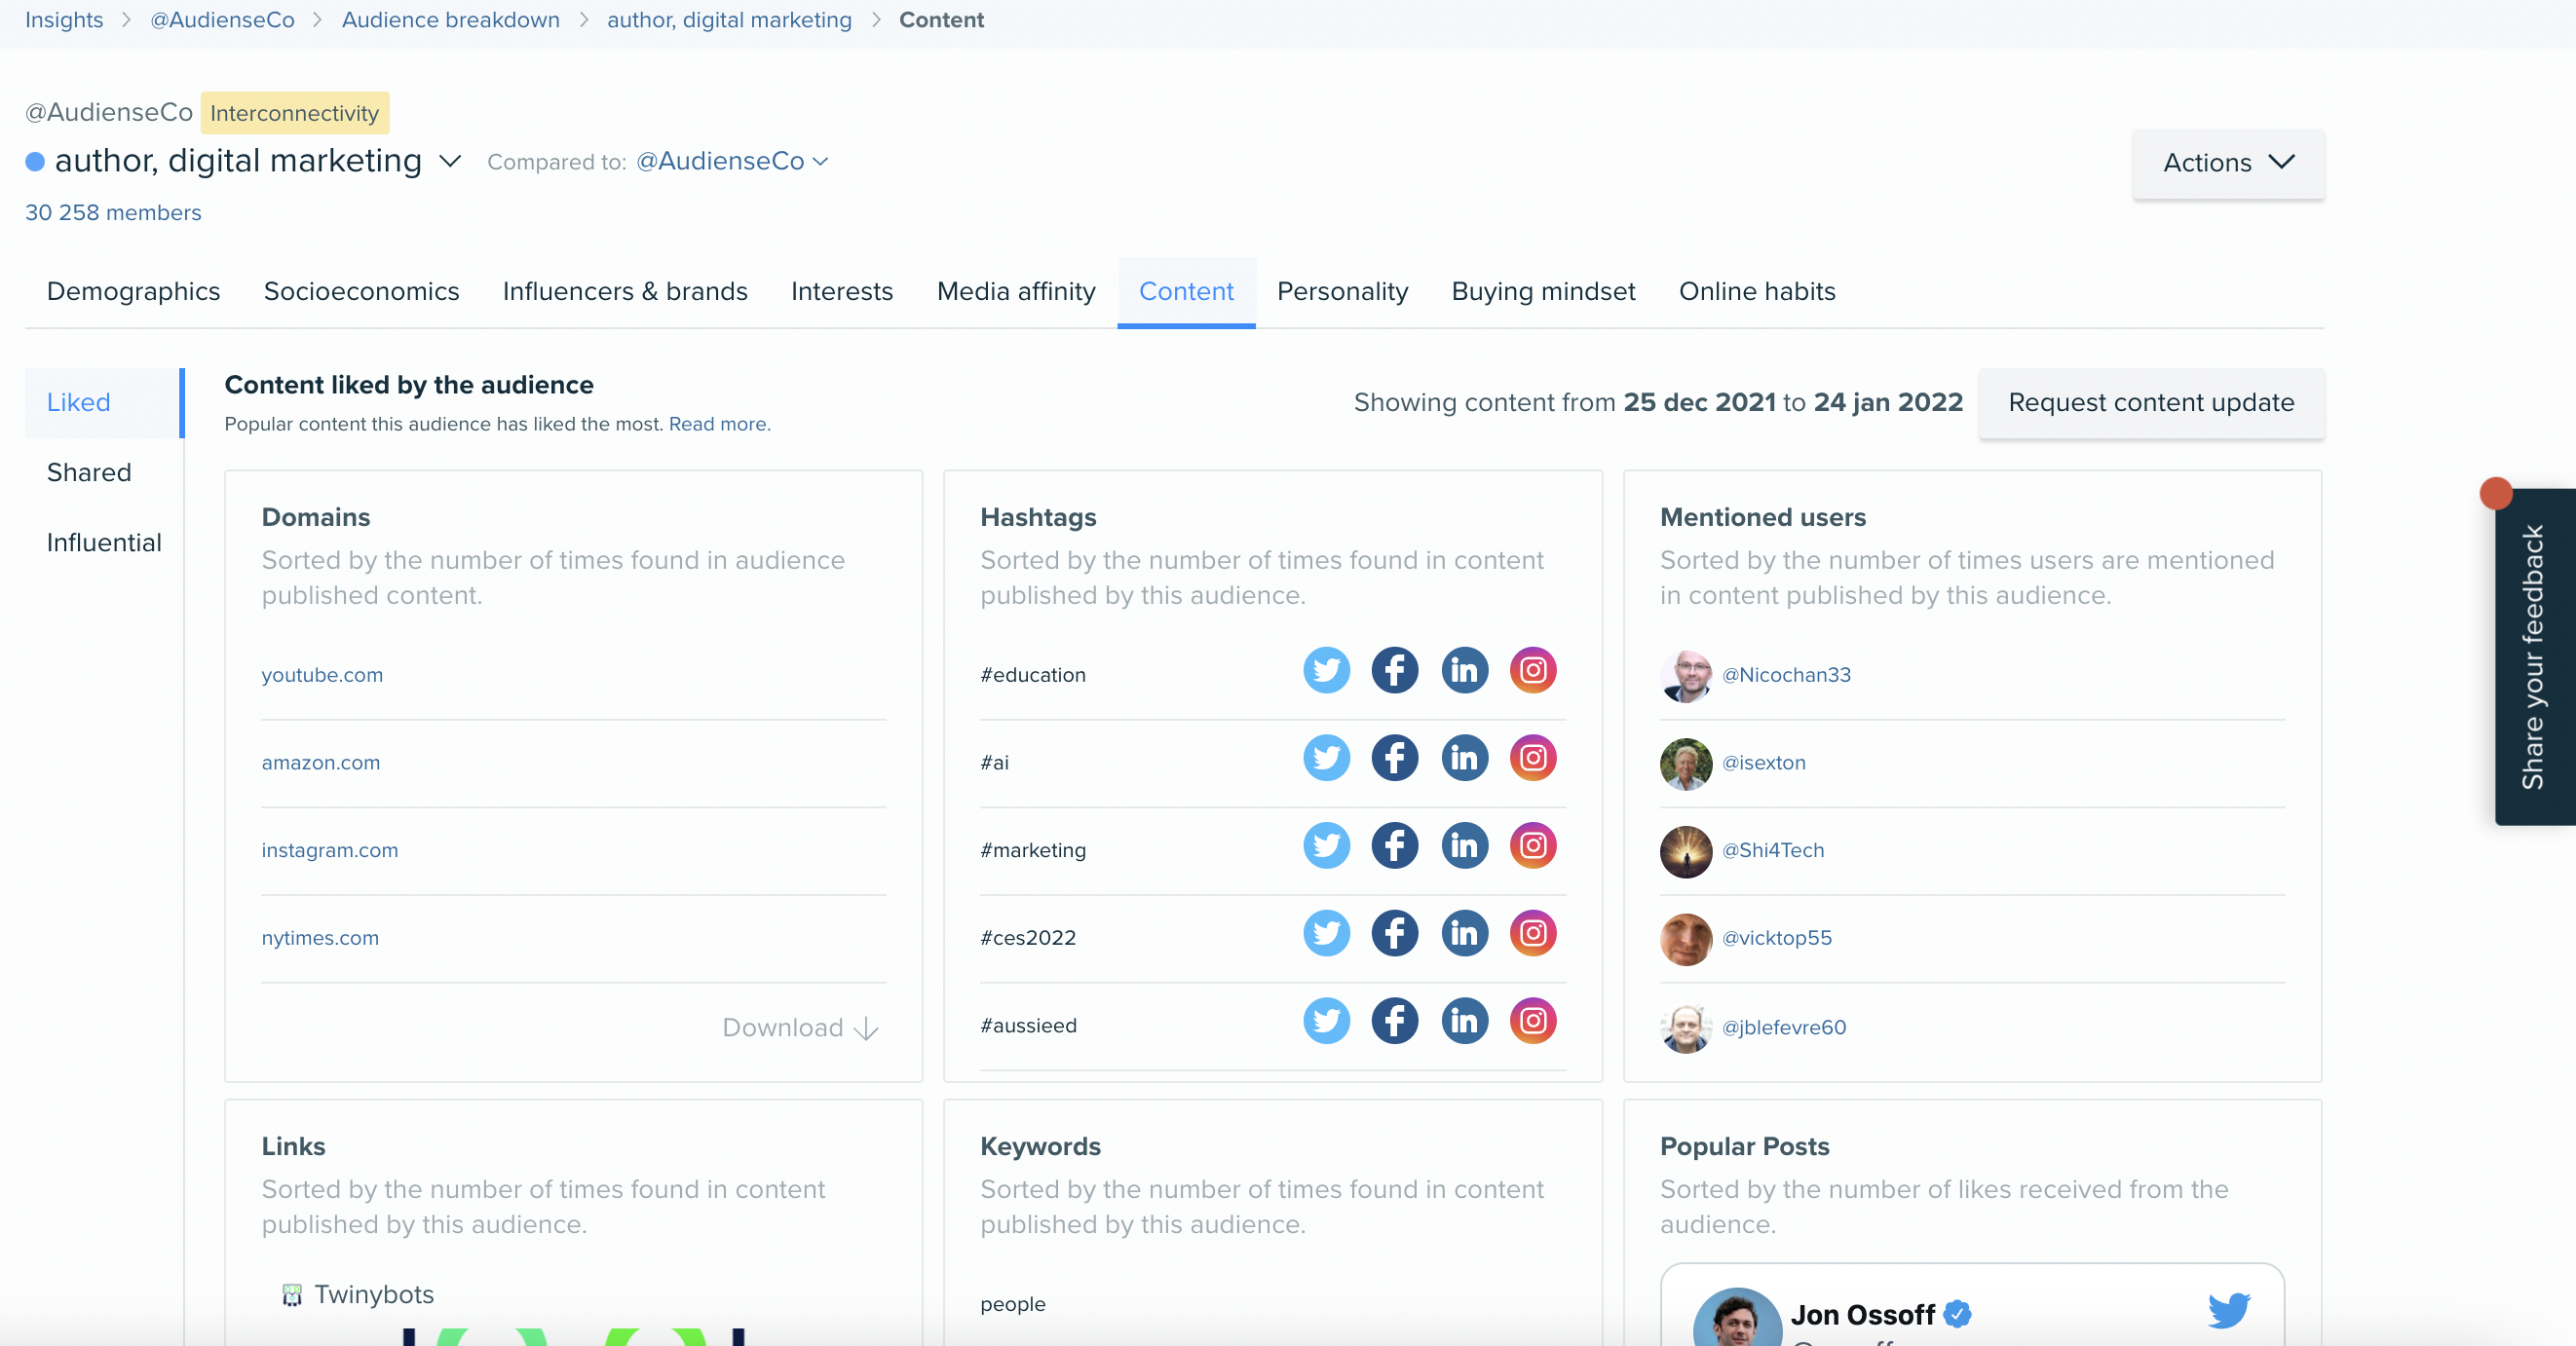
Content
This section shows the most relevant content (based on shares), the most unique and used keywords and the most relevant form of content your audience has an interest in.
When you first get to this tab you will see 3 different categories to the left: Liked, Shared, Influential. And in the main centre you will find all the different content panels, including domains, mentioned users, popular keywords, most relevant formats (Links, Photos, Gifs, Video), and more.
To learn more, read here.
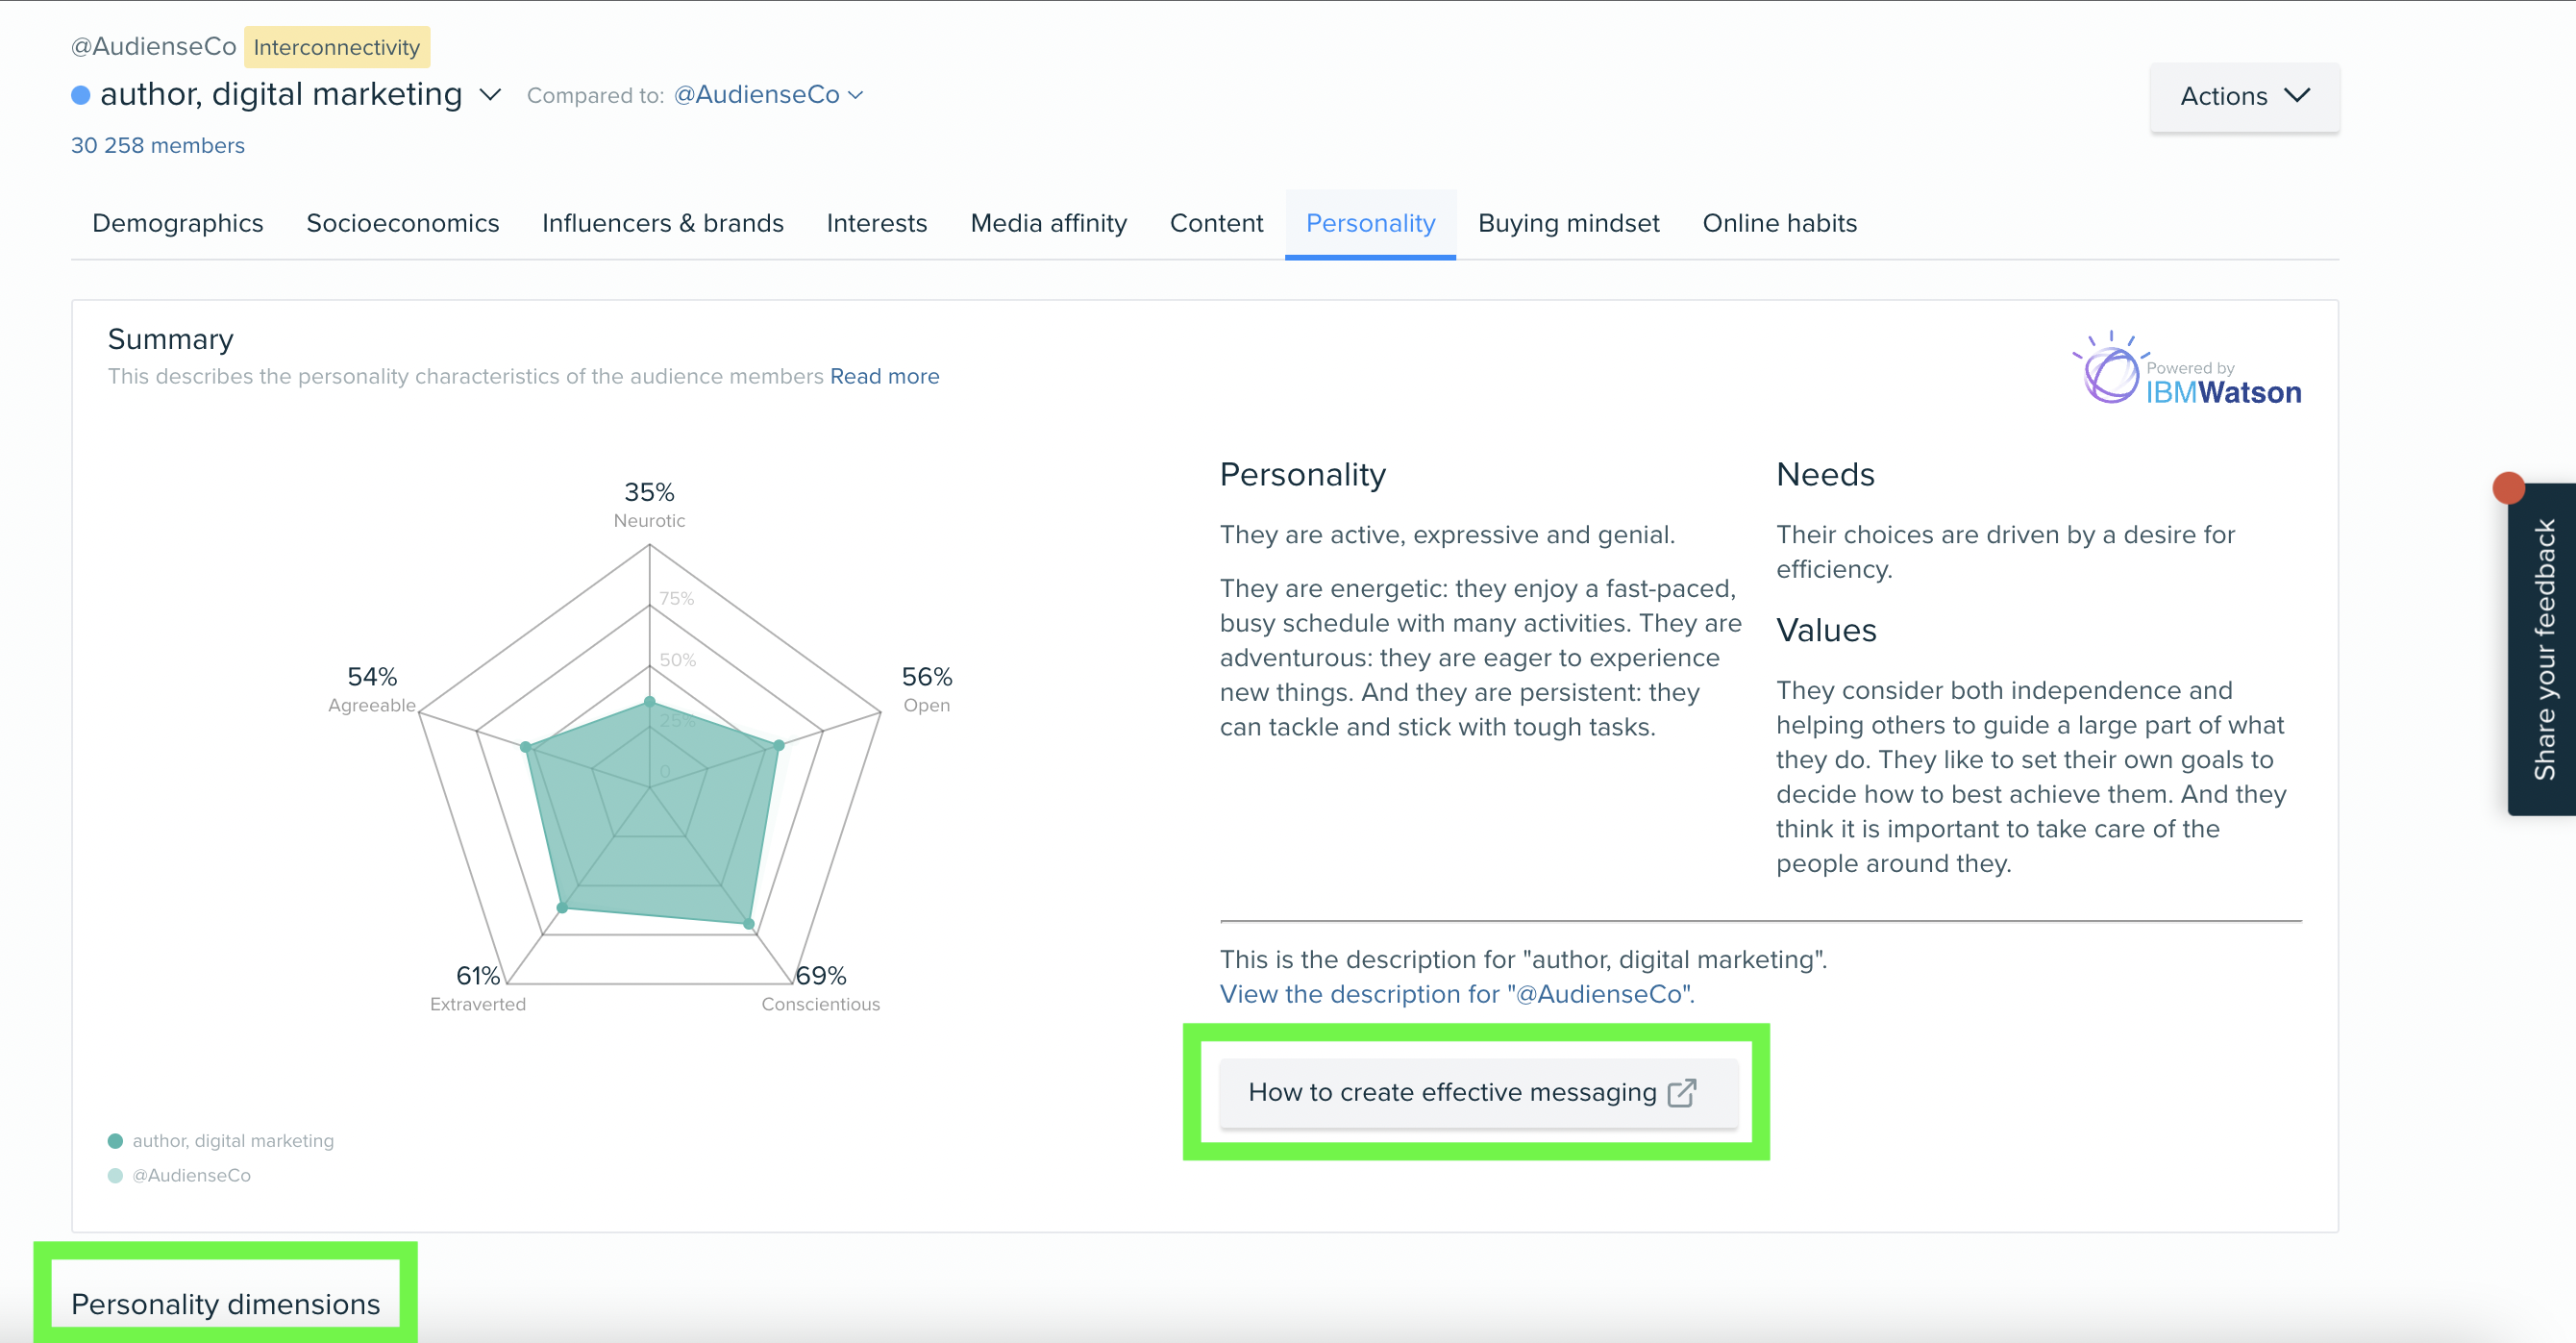
Personality
Powered by IBM Watson, we are able to deliver pyschographics on the 'Big 5': Open, Conscientious, Extraverted, Agreeable, Neurotic.
To help you action these personality insights, you can download our PDF on 'How to create effective messaging'.
Scroll down for the personality dimensions, needs, and values of this audience.
This can be quite new for beginner audience researchers, to understand more about this tab, read more here.
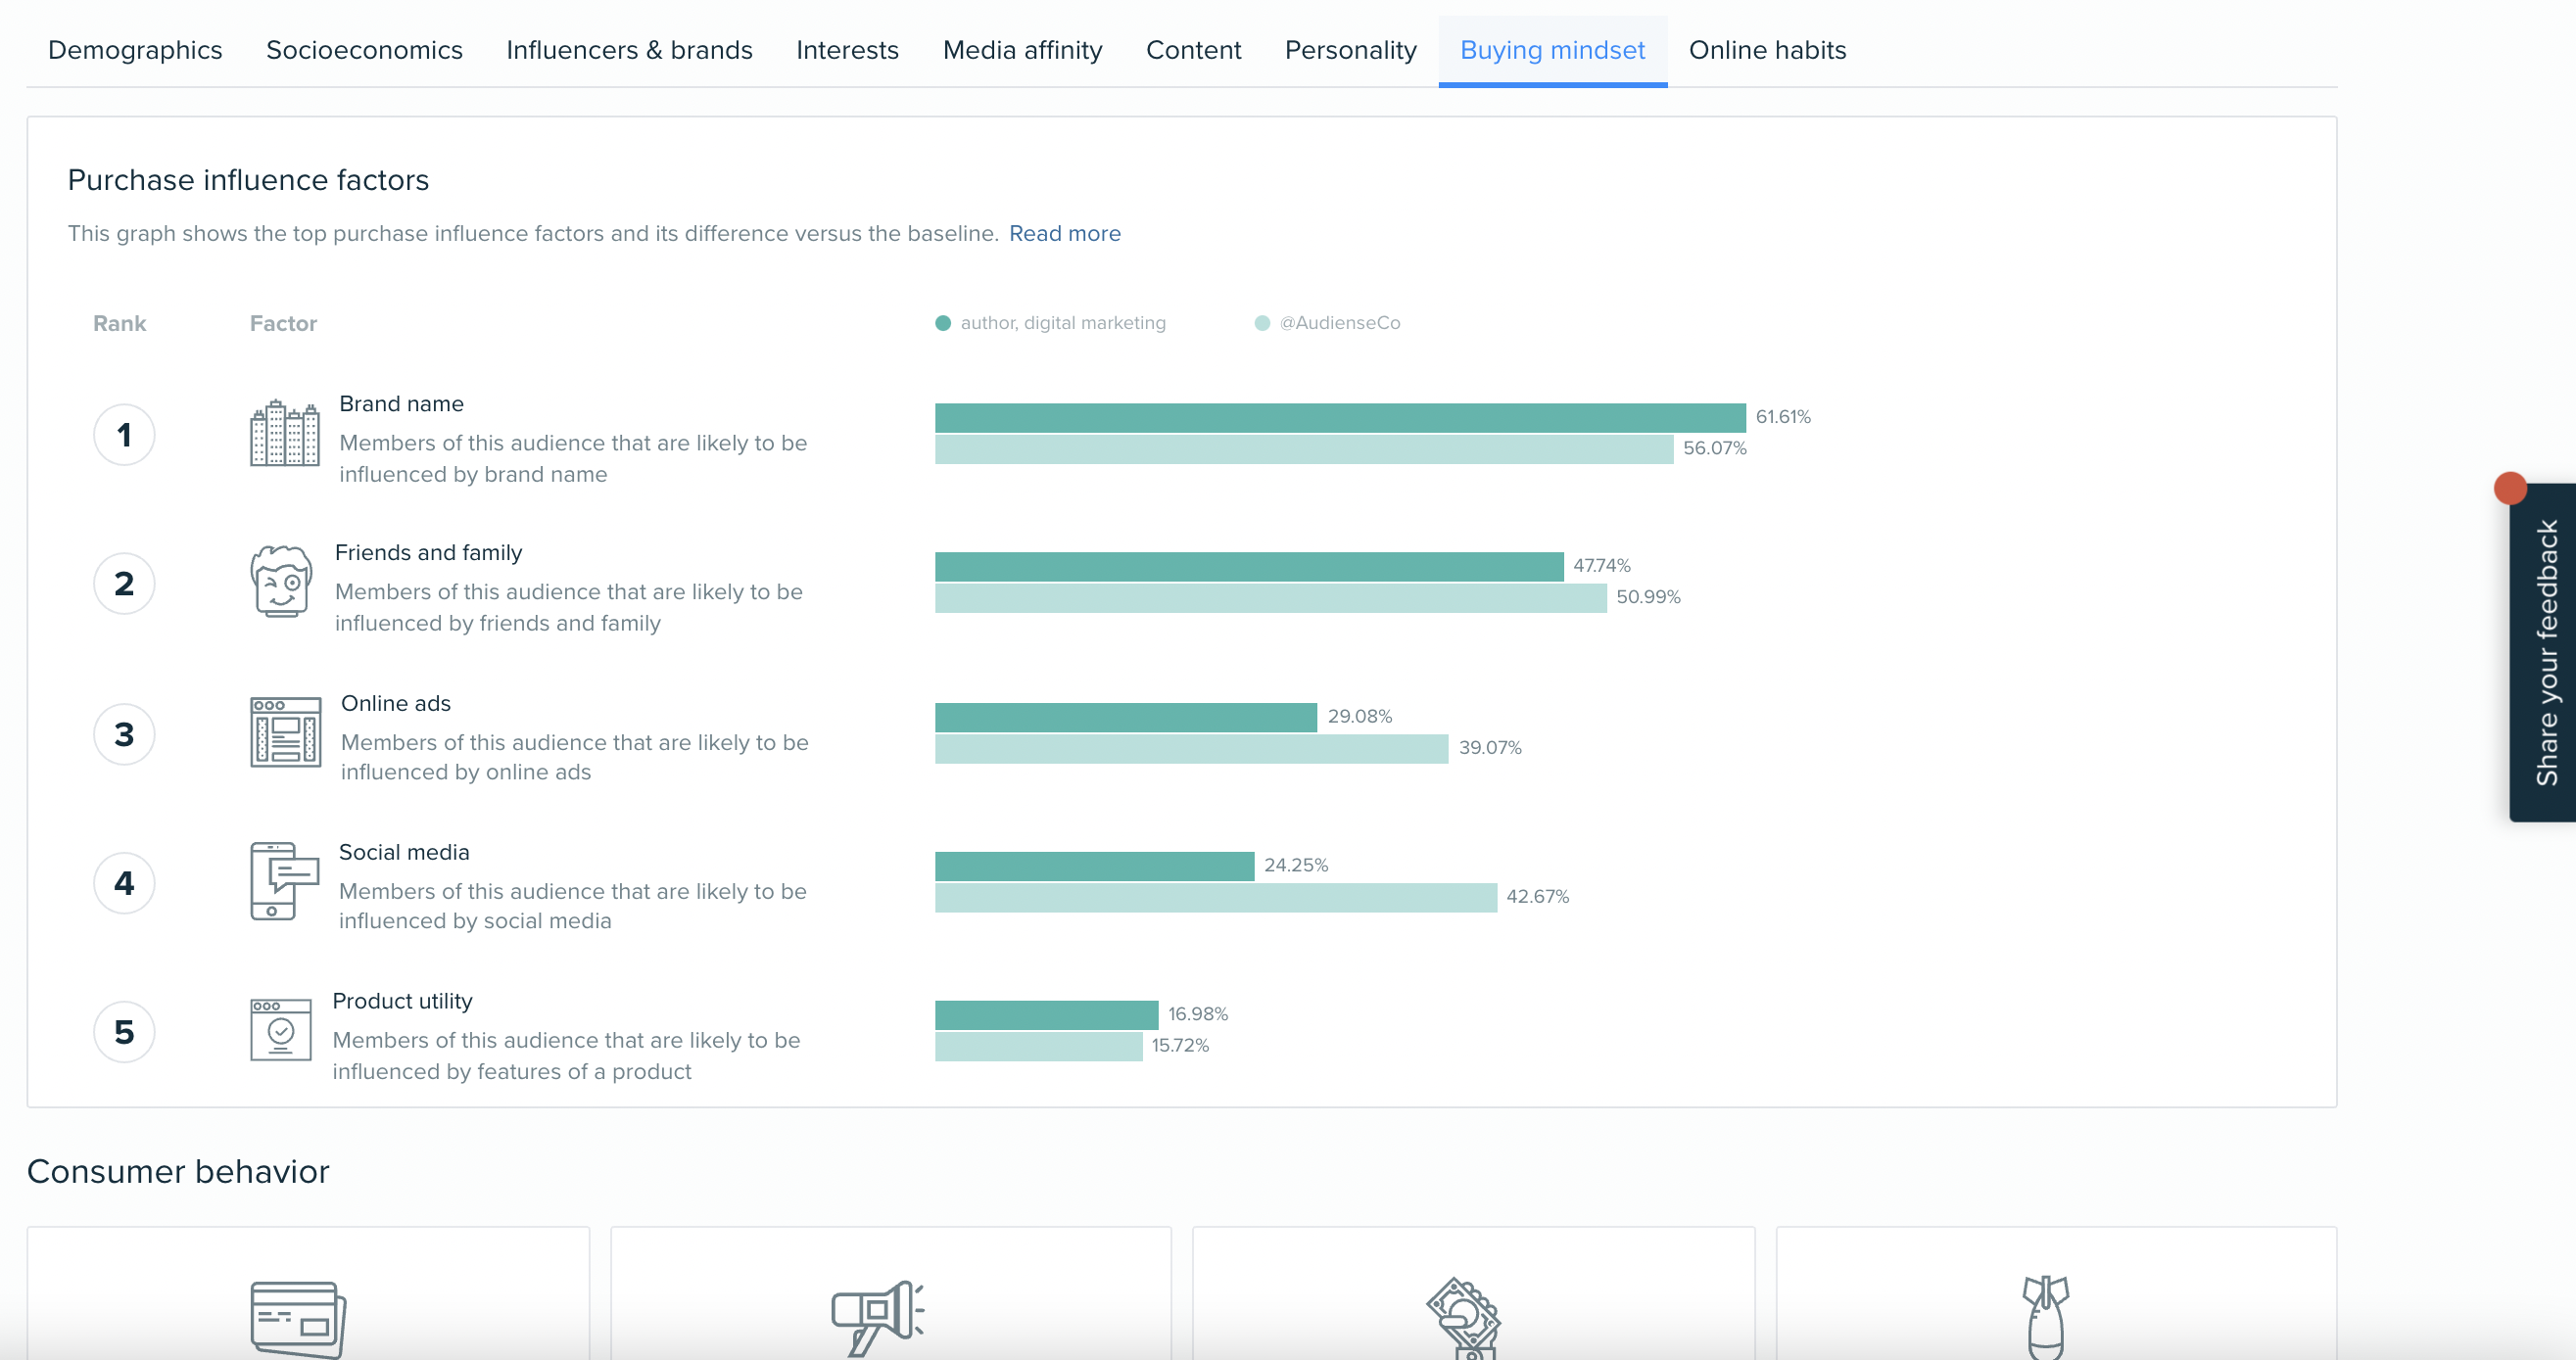
Buying Mindset
Also powered through IBM Watson, this delivers the purchase influencer factors, as well as scoring the audience based on their likeliness to use credit cards, respond to campaigns, respond to targeted ads, and make spur of the moment purchases.
Read more here.
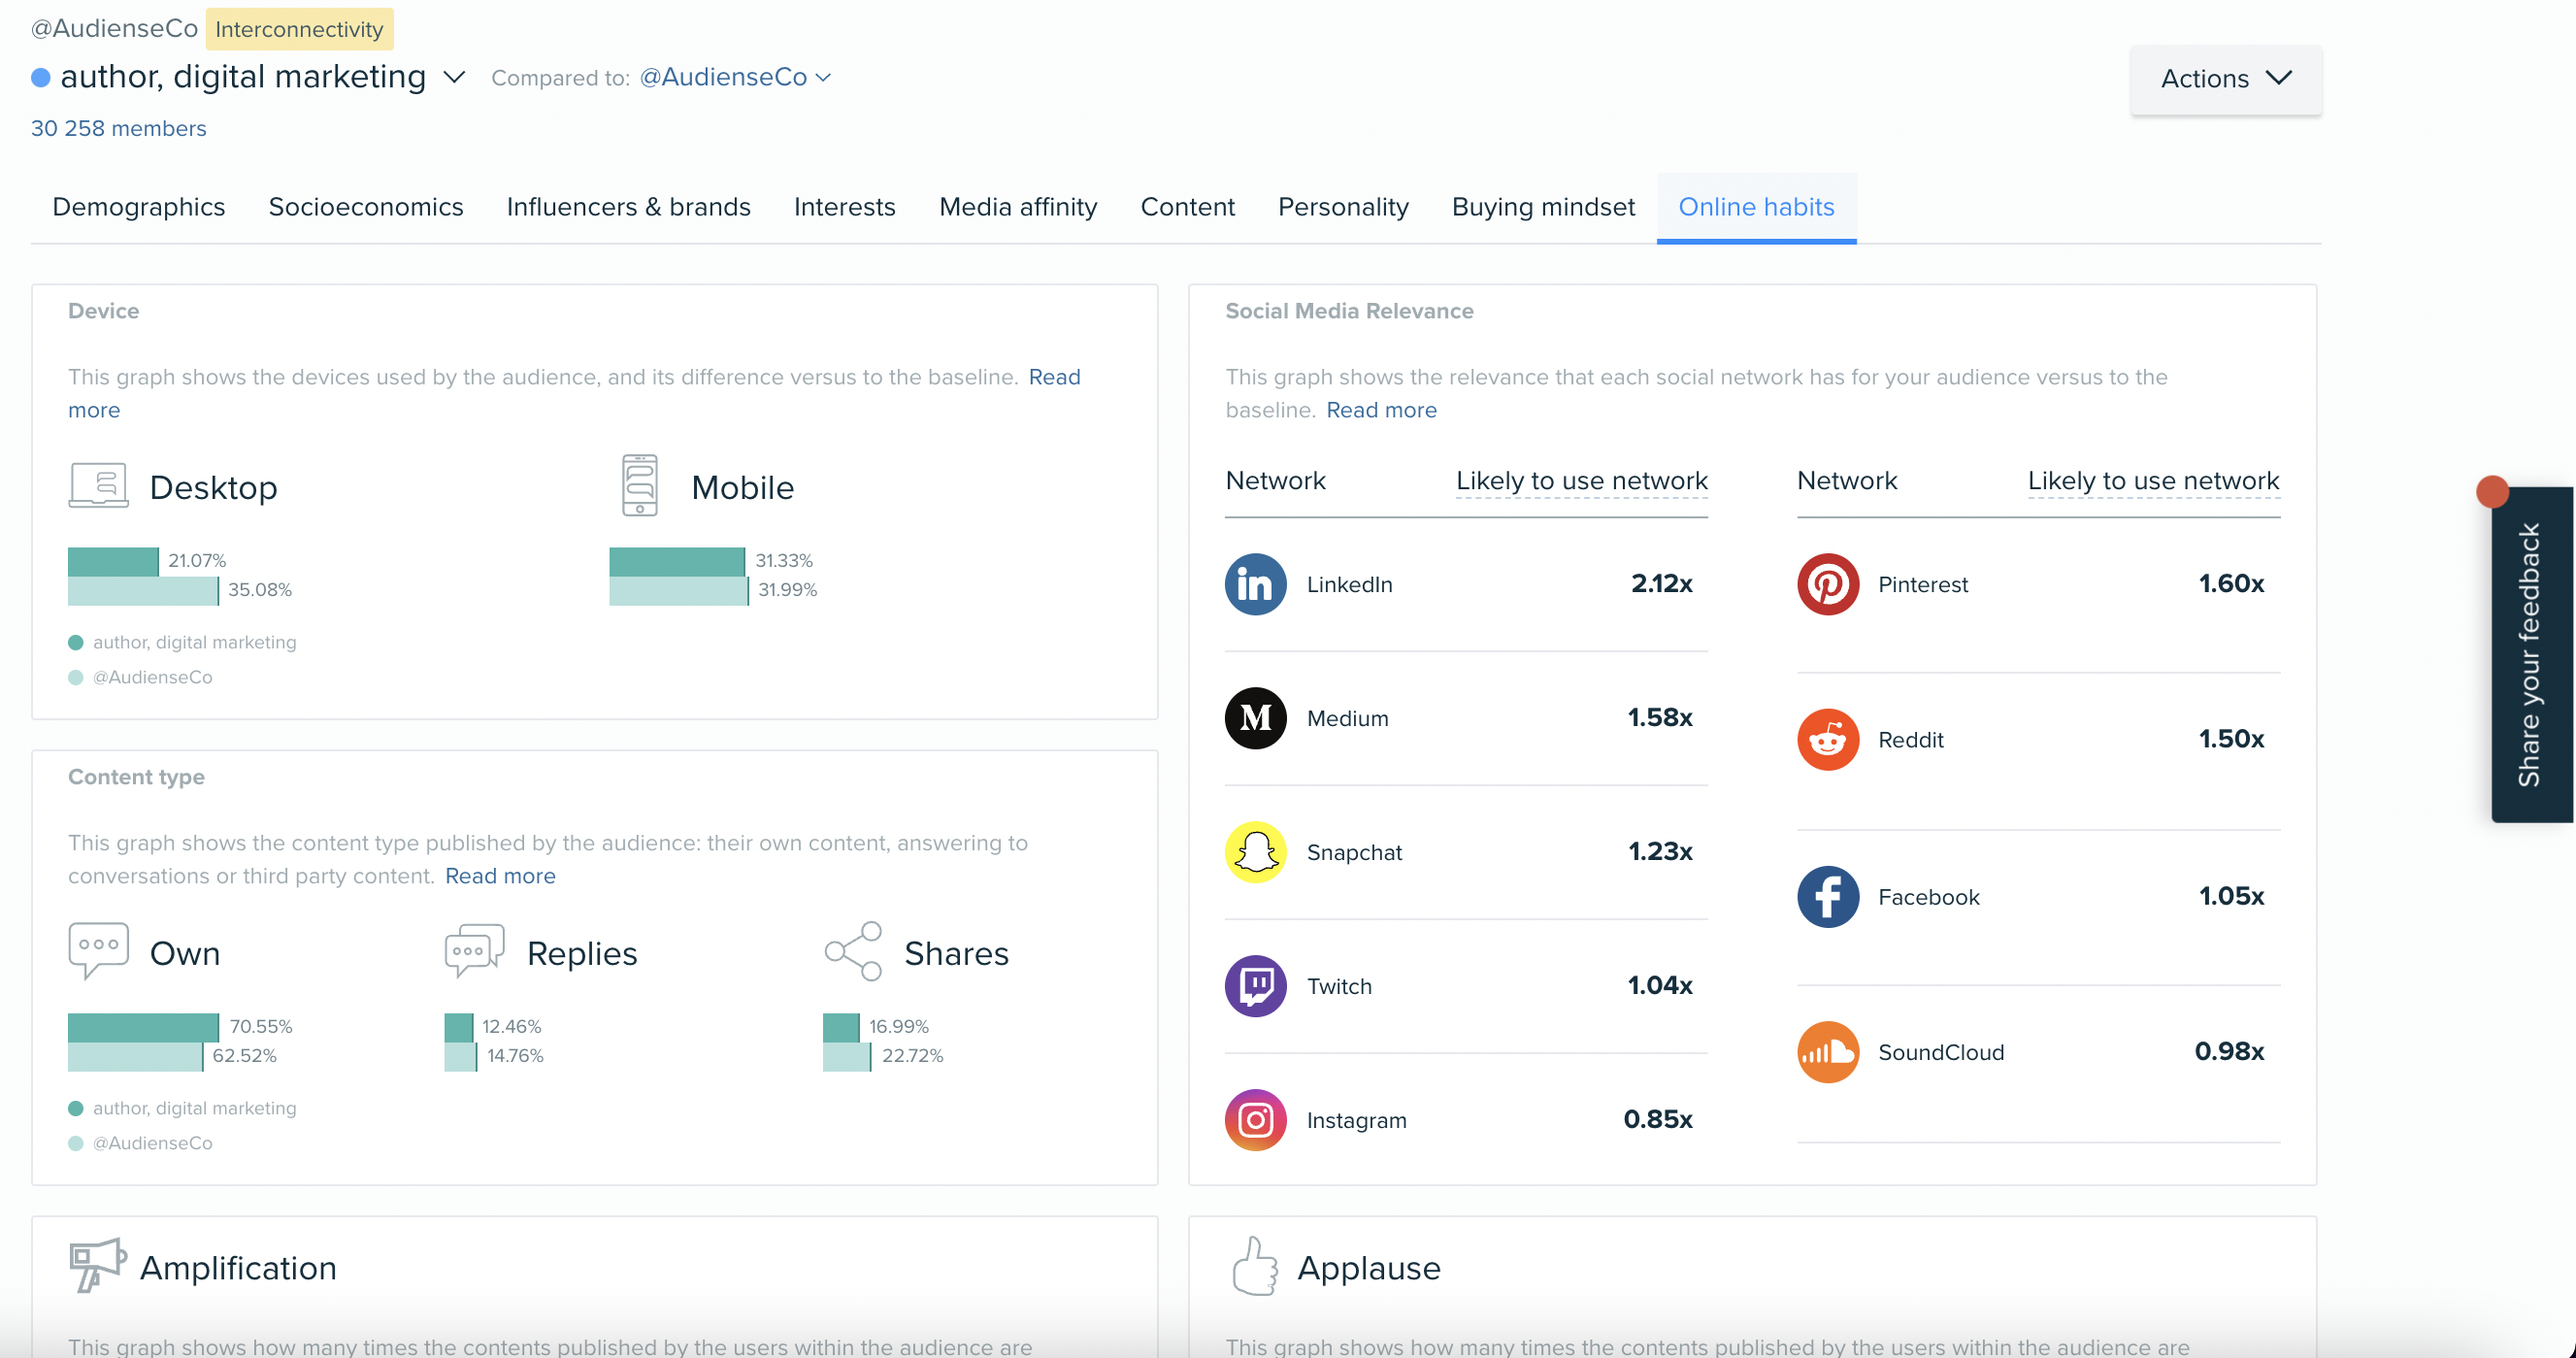
Online Habits
The final tab in an Insights report, including the device type being used, the content type being posted, the amplification and applause of content posted, active days, active hours, and Social Media Relevance.
Learn more about Online Habits here.