Audiense Connect is a large application which may appear complicated at first, so before getting started we recommend that you read this post and the homepage, dashboard and community wall posts to get an overview of the basics of Audiense.
Many functions and tools within the app have a green icon to the right of the name which you can click to go directly to the relevant post in this user guide to see how to use that tool, e.g.
There are three main areas in Audiense Connect: the homepage, the dashboard and the community wall (view).
Homepage
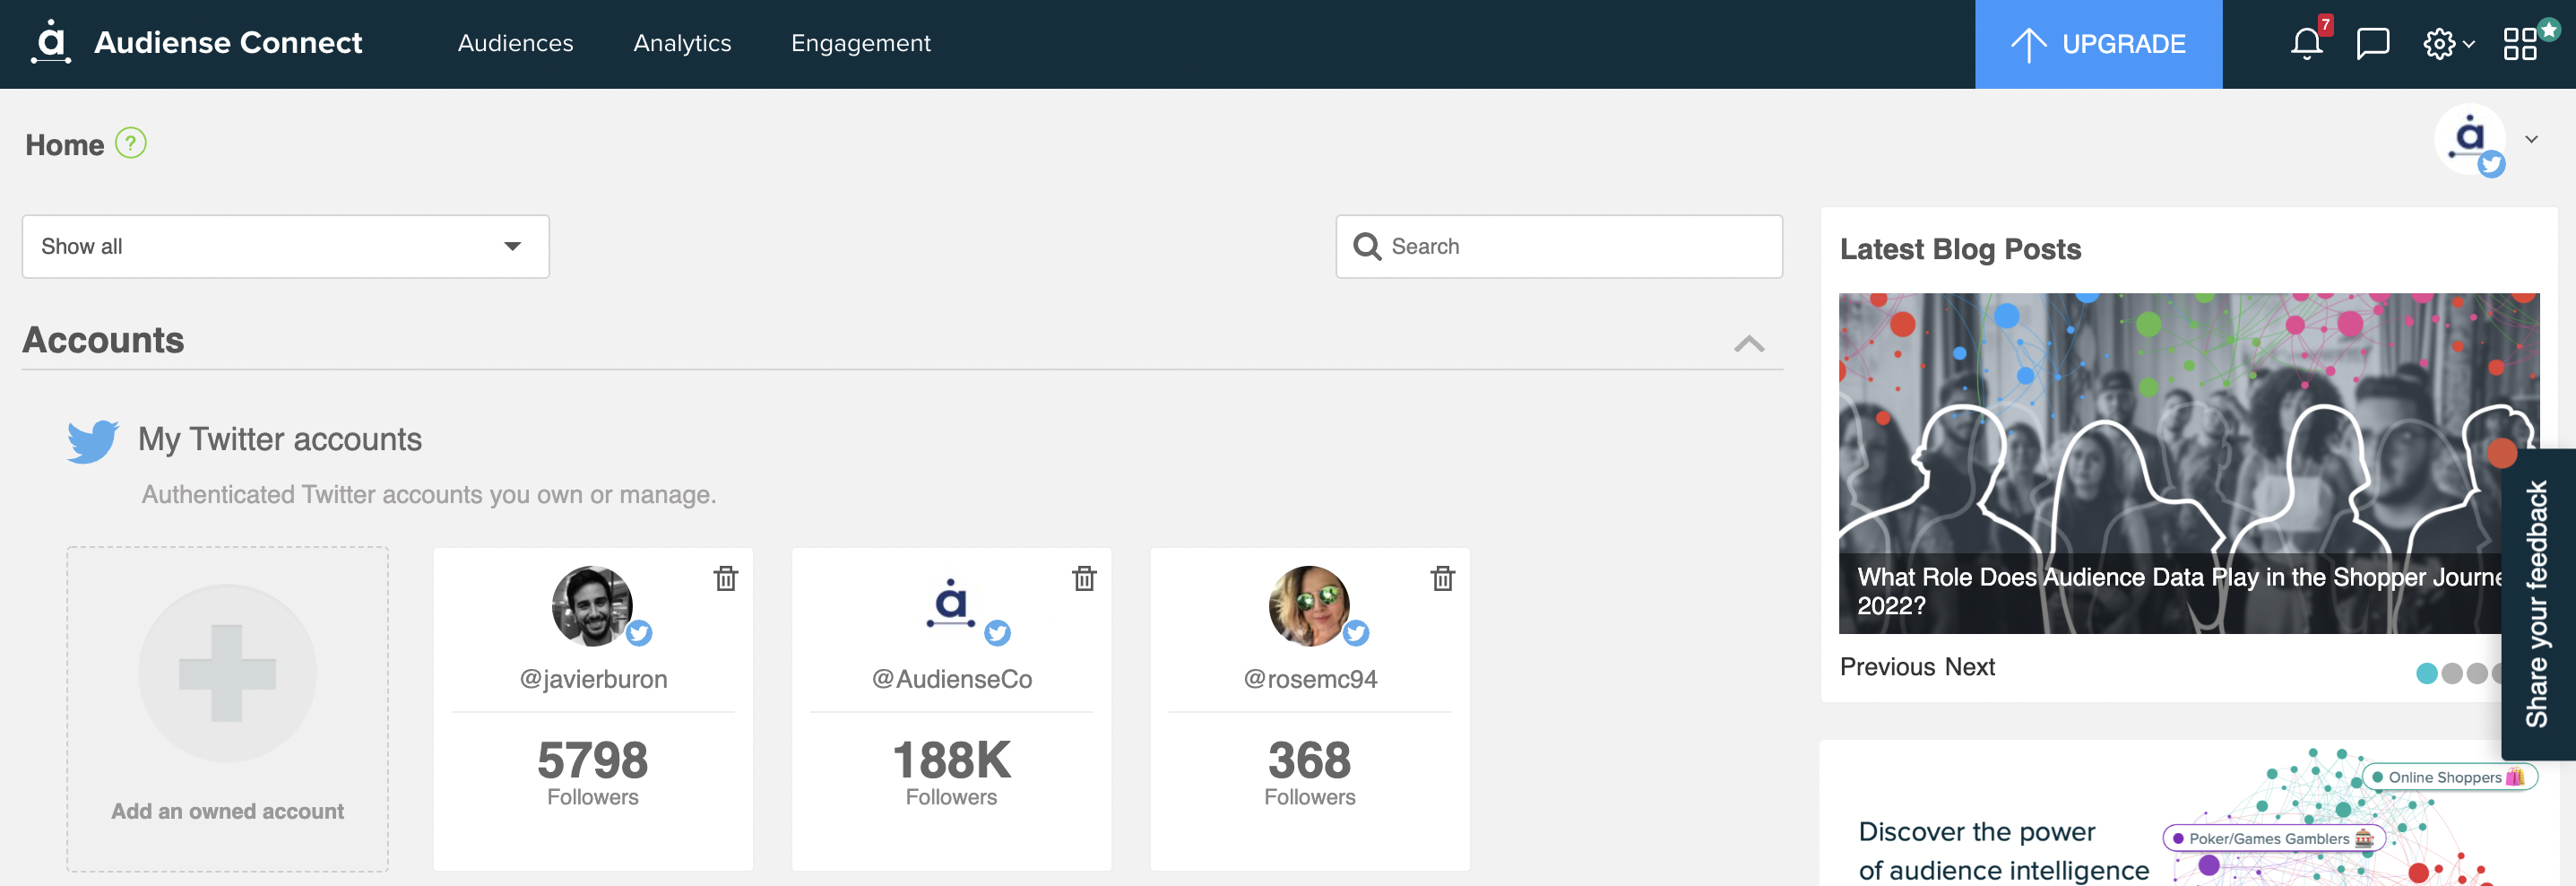
When you open Audiense for the first time, the first thing you see is the homepage. To return to the homepage at any time, click the Audiense logo or name on the top menu bar:

On the homepage you can see your owned account panel. See here how to add more accounts and sources as you progress with Audiense.
If you have just registered with Audiense, you won’t find the history of your account because we can only store data from the time of registration. From that time, you will see the history from the day you registered to the present day.
Dashboard
To access the dashboard:
- Click the top half of your account panel (Name/Logo)
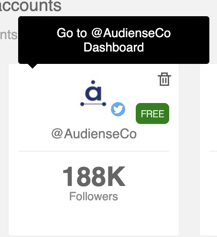
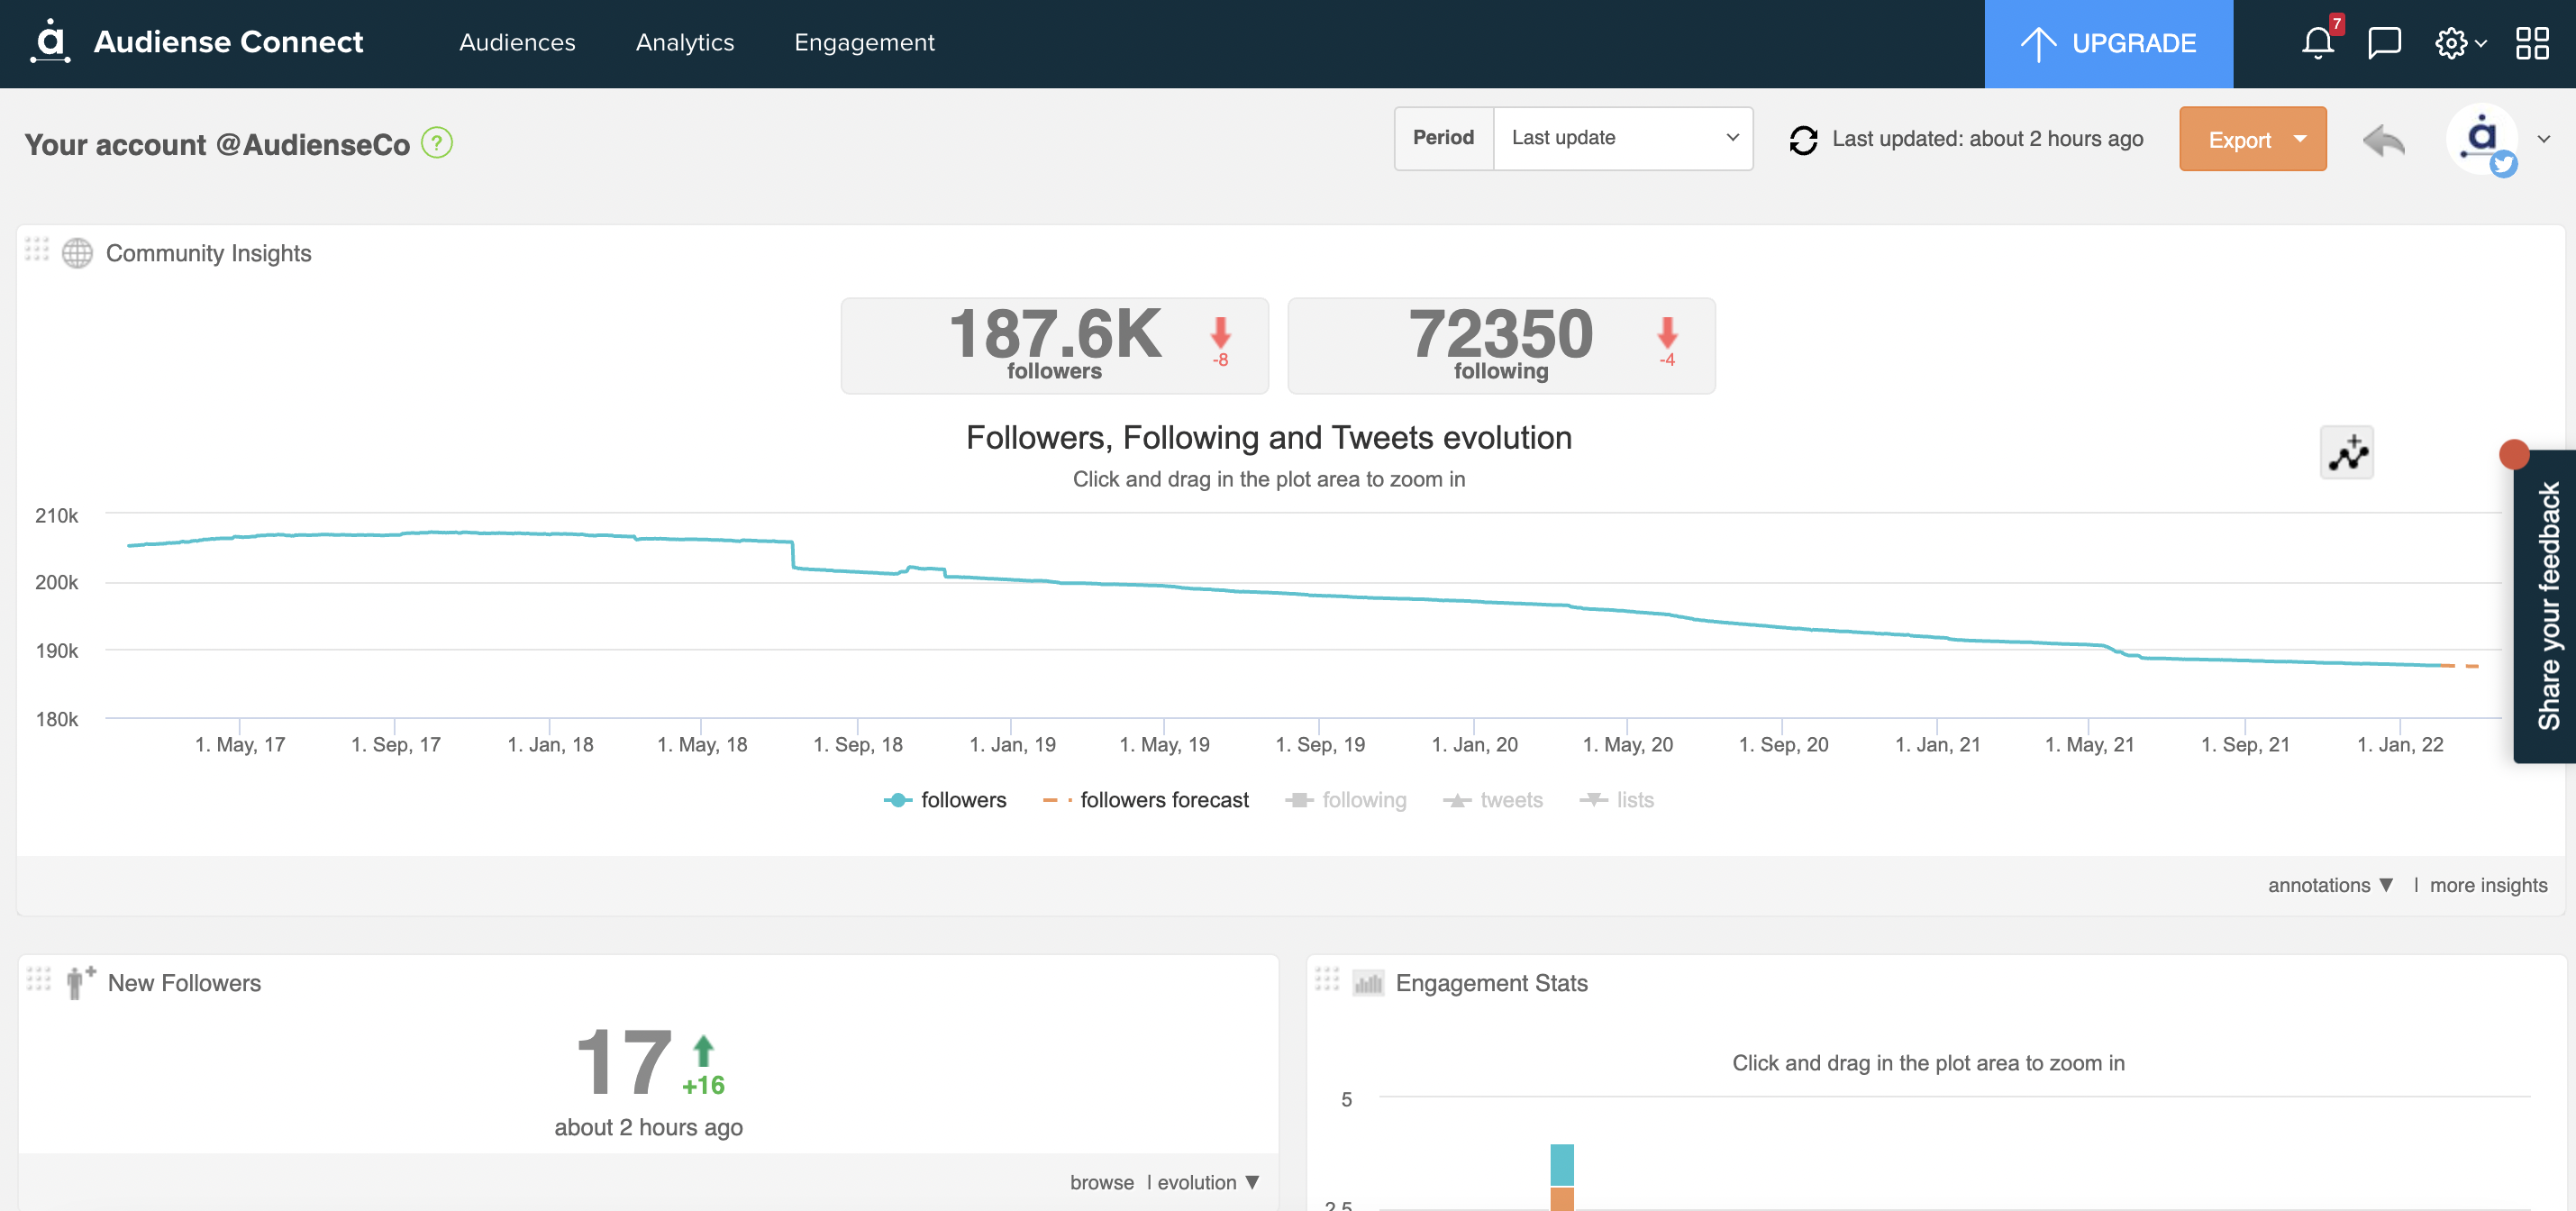
On the dashboard you can see an overview of your Twitter account in the form of panels and widgets. The data on these panels and widgets is based on the latest synchronisation, which occurs automatically every 24 hours, although you can change the time span of the data displayed using the period drop-down menu. You can easily visualize the growth of your Twitter community after each update.
The principal widgets are community insights and engagement stats, but you should read the dashboard post for more details (if you haven't already). The widgets are interactive, and you can click on them for more info, click and drag to zoom, etc. You can also save a filter and create a custom widget to show on the dashboard.
Community
You will notice we call this either Community Wall or Community view!
Your community (wall) are your followers (or those of any authenticated accounts) and community view is basically the below image (tiles with members), but this term can also reference the members in an audience that you have built and accessing through Connect)
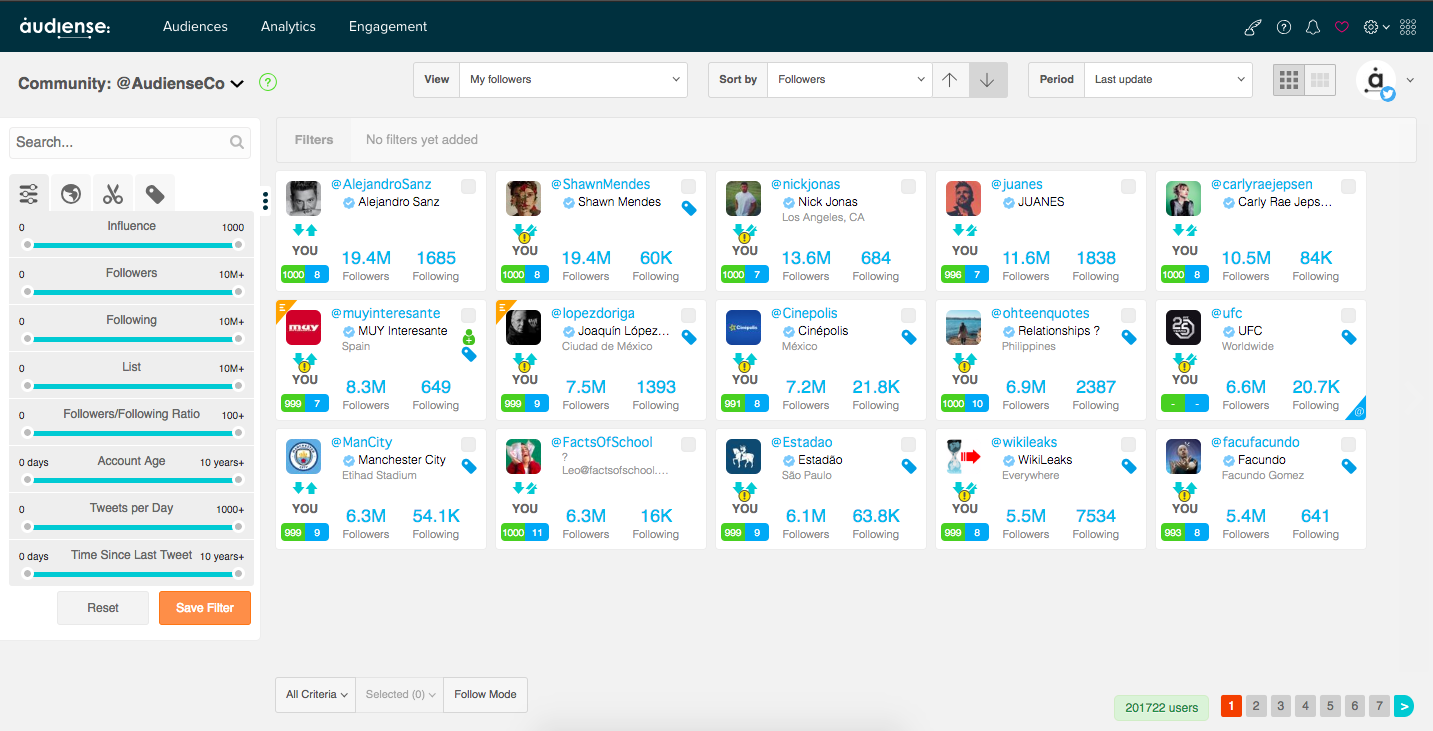
To access the community:
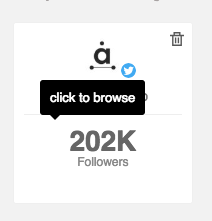
- Click on the bottom half of your account panel (number of followers)
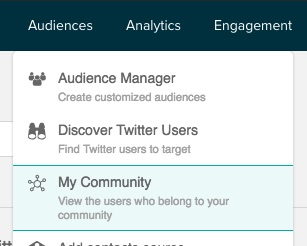
- or click my community on the top menu bar
The community view is where you can see the users, in the form of user cards, of a community or an audience. The search/filter sidebar and the community bottom bar are always active when viewing the community wall.
Start to use the filters and searches to get a feel for how they function, and follow/unfollow users. Generate a Best Time to Tweet report to see when your followers or a specific audience are online, and export a PDF to save to your computer.
When you’re comfortable exploring and browsing your own community, try taking a look at a third-party account. To do this, add it as a source. Remember, if you have a free account you are limited to 100 000 social contacts . If you add large accounts, you will quickly run out of space for any more of your own social contacts. However, you can delete these accounts from your dashboard to regain the social contacts.
Tools
The diagnostic heart of Audiense are the tools which allow you to efficiently target, analyse and engage with a community. Access these tools from the top menu bar.

For a brief description of the use of each tool, see below:
- Audiences – Add sources and bring into clear focus your target audience of clients, customers and influencers and define the right people to engage with. Use powerful search/filter functions that allow you to target your audience as individuals and deliver with precision.
- Analytics – Generate powerful insights about your audience, their interests and interactions using powerful stats and ‘out of the box’ analytics functions to build the most effective communication strategy with the most relevant content.
- Reports – Present your data to senior management with simple, visual layouts and easy-to-read graphics. Use Intersection reports, finding follower overlaps.

- Use Tweet Binder integration for advanced X analytics & monitoring. Read more here.
Note: Be aware that many of these tools are not available if you are using the Free version of Audiense.
