Audiense combines rich social data sources with machine learning within two separate dashboards, Audiense Insights & Audiense Connect.
Our data engine is based on more than 1.5 billion unique individual profiles, transforming social data into actionable audience intelligence, through proprietary technology, including segmentation, that enables brands and agencies to obtain value from insights collected from different channels, on demand and at scale, such as IBM Watson’s personality and consumer behavior insights.
Audiense Insights helps clients understand the different audience segments that form part of a wider defined target audience or those behind conversations, as well as how to activate them accordingly.
As part of our offering, we have multichannel access on and off-platform, provided by our solutions team, including social and search data, which allows users to go beyond twitter and join different data points for a wider consumer or market analysis, including Meta.
Our recent acquisition of SOPRISM, an extraordinary consumer insight tool (Meta Audience Insights), will add a new layer of insight to Audiense reports, by accessing and profiling audiences across the Meta network.
In this guide, we will explore:
- How is Audiense able to extract insights?
- Social analytics vs social data
- Twitter as a data source
- How are Audiense Insights tabs/features calculated?
- Data enrichment & update frequency
- Qualitative vs Quantitative Research
- What methodology am I using with Audiense Insights?
-
-
- How do you link profiles to different networks?
- Availability: what market coverage does Audiense have?
- Why and when is Twitter data excellent for research?
- Data Beyond Twitter: Which data/how is the data incorporated in the insights?
- What qualitative data can Audiense Insights provide?
- Example case studies
-
- SOPRISM by Audiense (Meta Audience Insights)
- SOPRISM Data FAQs
-
- Where does SOPRISM data come from?
- What is SOPRISM’s methodology for generating audiences?
- Does SOPRISM respect the GDPR norms and directives?
- What is Facebook’s ability to understand its active users?
- What type of informations does Facebook process to understand an audience?
-
How is Audiense able to extract insights?
Our approach is to compliantly use publicly available information, using our own algorithms (AI) and third party sources (Partners) to enrich our own database and surface deep audience insights.
From what sources?
We gather data from a variety of social networks, including Twitter, Facebook, Instagram and YouTube, to name a few, as well as public censuses, on a granular and aggregate level. However, within the Social Data industry, Twitter is the only trully open source platform available, therefore it is our main source of data direct from the Twitter API.
Through our partnership with Twitter, we can access tweets and engagements since 2006 to present day, to regularly enrich our database with updated follower and interaction data.
Our API access includes the Decahose (delivering 10% of tweets; approx. 40mill per day), and a separate stream of Likes, which we display in our Content tab within Audiense Insights to display not only shared or influential content, but liked content by a full audience and individual segments.
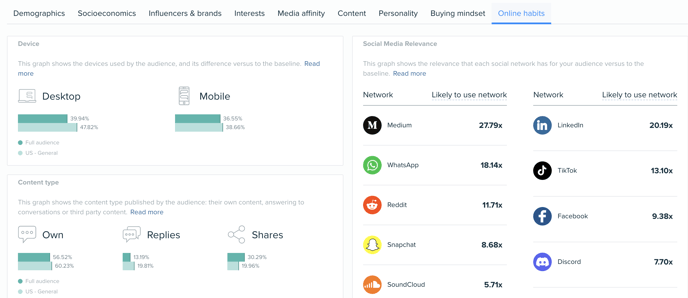
As a Twitter partner, Audiense has the ability to identify the most valuable and creative ways to use Twitter Data within our platform. For instance, more than 500M Instagram and Facebook posts are tweeted every month, enabling us to also identify other networks that are relevant to an audience (social network relevancy is displayed in our online habits tab). You can see more about the Twitter API on this link.
Similarly, our partnership with the leading global AI technology - IBM Watson, has enriched over 90 million profiles within our database with personality insights, based on sociolinguistics and consumer behavior analysis, helping us develop a deep understanding around effective personalization from the combination of machine learning and AI.
Furthermore, our integrations with the most advanced social listening platforms, Pulsar and Meltwater, connect audience insights to social data trends and narratives.
Data sources: integrations
- Twitter API (tweets, follows, likes...)
- IBM Watson (personality insights, consumer behavior)
- FB Ads API (socioeconomics - aggregated data)
- Census (socioeconomics, as well as gender and age)
- Integrations with social listening platforms: Pulsar, Meltwater (Twitter IDs or handles)
- Integration with search data: Semrush (Beta)
- Integration with Online survey data: GWI (Beta)
- Integration with DSPs (connect with audience and lookalikes programmatically)
- Content/category taxonomy
- Interests:
-
-
- IAB (Interactive Advertising Bureau)
- Affinity interests: Spotify, Podchaser, Netflix, Onalytica, IMDb
- Influencers & brands content creators: Social networks, also incl. bloggers, podcasters, Twitchers, YouTubers and journalists
- Media affinities: offline & online channels
-
- Targeting pack: criteria for Facebook, Twitter, YouTube, Google Ads, incl. domains.
Social analytics vs social data
It is important to point out that there are differences in the level of insights that platforms provide, and why we felt it important to explain the differences between social analytics and social data.
It is very common for Social Analytics to be used interchangeably with Social Data. Where Social Analytics is a means to provide performance analytics for brands across social media. A few of the most common metrics are the number of fans, followers, impressions, etc. which are easily accessible regardless of network (including Facebook and Instagram).
Social Data on the other hand focuses on surfacing community insights, exploring conversations and/or campaigns. For example, Unmetric is considered a social analytics tool exclusively, whereas Audiense would be considered a Social Data tool, and then there are platforms such as Pulsar that do both.
Within Social Data we are able to differentiate between the type of data under scrutiny, whether it be Conversation Insights (i.e. Social Listening platforms such as Pulsar, Brandwatch, Meltwater or NetBase, to name a few) and Audience Segmentation and Insights (i.e. Audience Intelligence platforms such as Audiense or Affinio).

Understanding the difference between social listening (sometimes referred to as social media monitoring) and audience intelligence is also critical. Put simply—social listening monitors conversations across social media channels, while audience insights delivers a true understanding of whom the audience is behind the conversation by looking into their affinities and behaviors, going that step further with data analysis.
The emergence of audience intelligence platforms is disrupting the industry by taking a different approach to analyzing social media conversations and behaviors. However, the way in which we do this can differ somewhat, due to proprietary technology and sources used!
Twitter as a Data Source
Data access isn’t universal, as no data source provides the same level of access, and we can only collect publicly available information from social media and internet sites.
As a data source, Twitter is the front-runner for most social intelligence platforms, mentioned previously, as it’s the only open source platform, whereas other platforms, such as Meta or TikTok, will provide partial/aggregated data via their API. Some channels will only provide account level metrics (Social Analytics), which will show profile performance, making it near impossible to access audience insights beyond demographics. Some social media platforms tend to provide their own metrics, such as Facebook Audience Insights, rather than make this publicly available, and instead provide access to specific data. For instance, in Facebook’s case, via their FB Ads API.
There is a lot of emphasis placed on Meta’s channels, but we need to understand they are not the only or, in fact, the best data source for that matter on every occasion (use case). For monitoring our campaigns, access to these channels may be key, but we must bear in mind that all data sources have their own personalities, and nature, so we will find different types of conversations happening on them, so it is important to think about each data source separately.
This is why Audiense encourages its users to join data points in their analysis, and we keep adding valuable integrations to our Audiense Insights platform.
Now with our Acquisition of SOPRISM, as mentioned above, we are able to provide access to Meta audiences, and complement Audiense Insigths, as well as Social Listening.
Why is Twitter Data a Powerful Source of Audience Insight?
As it is a newer and less well understood method than traditional survey based research, we sometimes hear of concerns that data from Twitter may not be enough to build accurate insights.
If you’ve concerns about this yourself, here are three important reasons which confirm Twitter data is a powerful source of insight:
Bigger Sample Size than traditional survey research
Using Audiense, the global Twitter audience is available to analyze and segment, meaning instant access to a survey sample of nearly 400 million users - and which covers the whole range of age groups, genders, interest groups and markets. To our knowledge, there is no current survey based solution which can offer a potential audience sample of that overall size and breadth.
Research Data is available instantly
Unlike many survey based solutions, Audience data is available in the short time it takes for the platform to generate a report (approx. 10-20 mins depending on the audience definition). This means that a wide range of data from a huge sample audience is available instantly - covering key areas as Demographics, Interests, Influencers, Personality and Media preferences.
More ‘honest’ and accurate data
As every researcher and analyst knows only too well, respondents often share an idealized version of themselves when answering survey questions. Since Audiense uses Twitter data which represents audience's real world behaviors and preferences (such as the social accounts they follow) what is available is more representative of how audiences actually are - rather than how they would want to be perceived.
The basis for generating insights
Generally, Audiense infers audience insights according to public interactions (tweets, follows, likes and other engagements), the public information available within profiles of the users (name, profile photo, time zone, location), other public aggregated information (demographic census for specific segments based on surveys and other digital interactions) or a combination.
How are Audiense Insights tabs/features calculated
There are certain variables which we/our partners train their algorithms with which are considered to be highly weighted but not exclusive to:
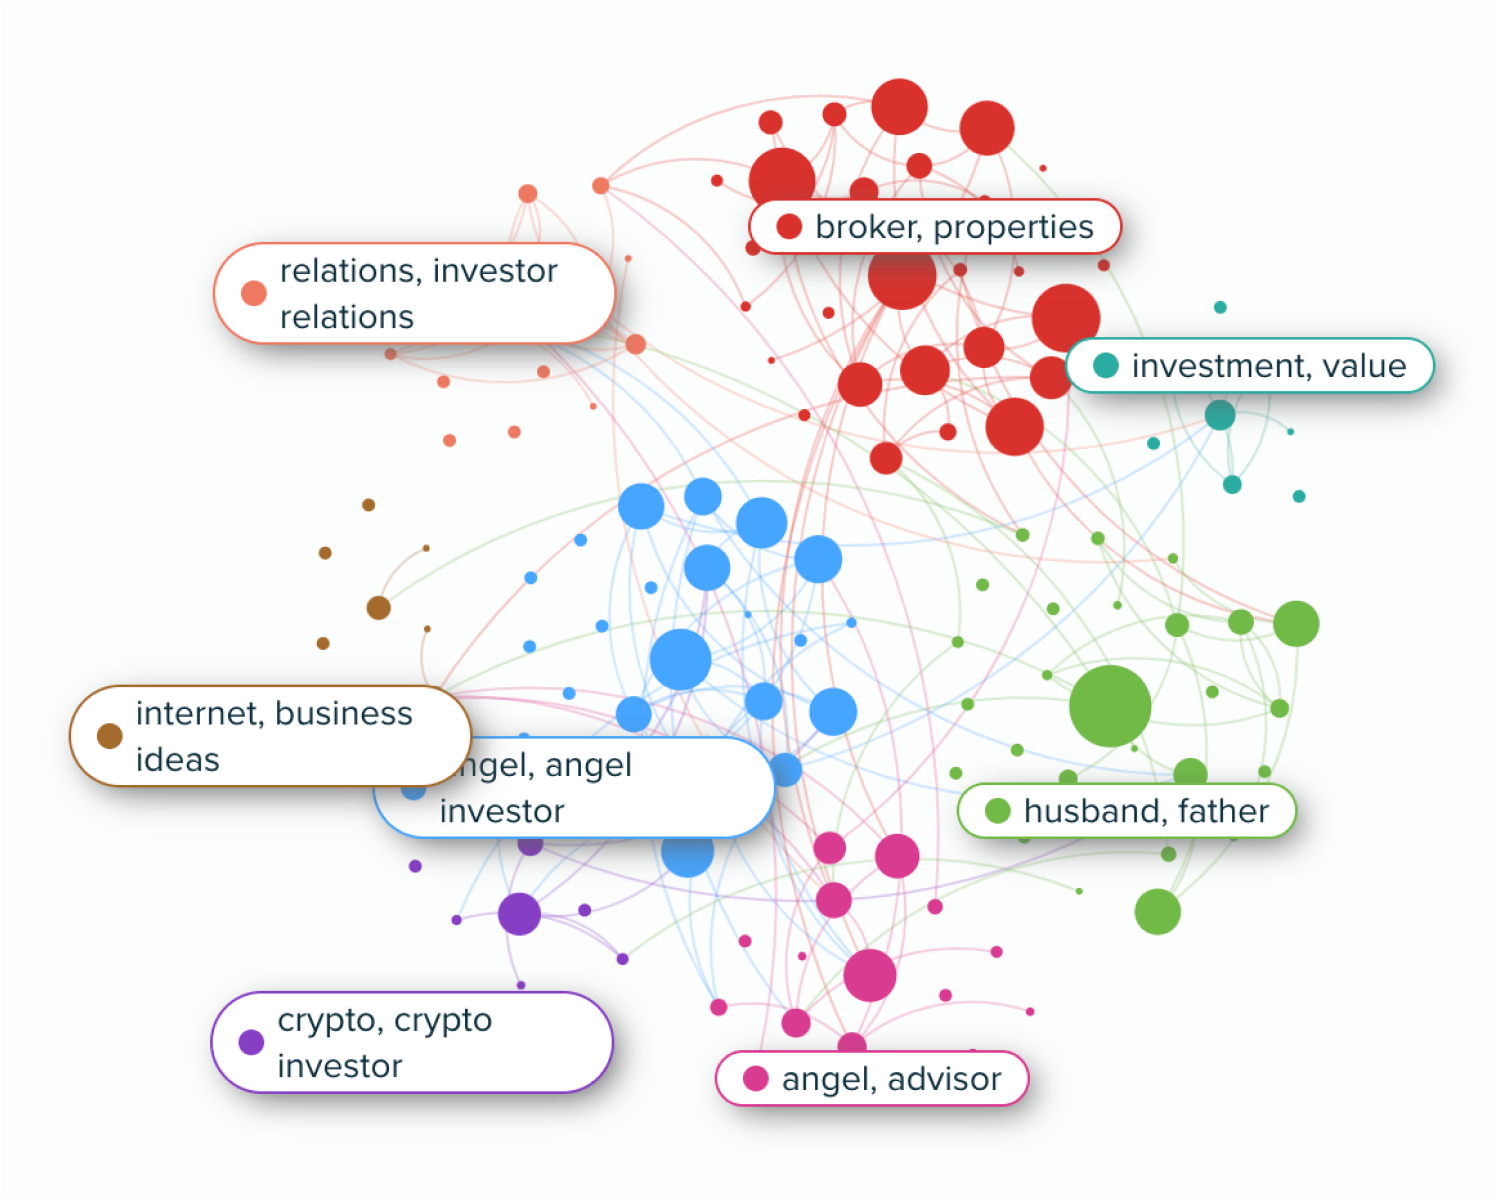
- Segmentation: network graph analysis, incl. relationships between people (e.g. followed accounts and engagements incl. replies or liked content) - Learn more
- Auto-naming segments: profile bio self-descriptions - Learn more
- Demographics: profile photo, explicit locations, bio self-descriptions, public censuses, name, relationships, timezone, social posts - Learn more
- Socioeconomics: Facebook Ads API (aggregated data), age, interests, self-descriptions, and public censuses (Household Income available for US only audiences) - Learn more
- Interests: social posts (topics), relationships (followed accounts) - Learn more
- Content: Twitter API Decahose and streaming Likes (social posts: shared, liked and influential posts) - incl. Domains, mentioned users, media formats, most popular… - Learn more
- Personality Insights: posts, sociolinguistics (IBM Watson study: Big Five OCEAN Personality model) - Learn more
- Buying Mindset/Behavior: social posts, sociolinguistics (IBM Watson study: consumer behavior/purchase influences) - learn more
- Online Habits: photo profile, explicit locations, self-descriptions, surveys, name, relationships, timezone, social posts - Learn more
- Multichannel activation: social posts, relationships (followed accounts) - Learn more
Data enrichment & update frequency
- Audiense has a dataset of more than 1.5B Twitter profiles
- We are updating an average of 11M users per day
- It takes approximately 7 days to complete a loop through the full 1.5B user profiles
Differences between qualitative and quantitative research, and why it is essential that you know this distinction when using Audiense Insights?
An important thing you need to know about is the difference between Qualitative, Quantitative research and mixed methods like Audiense.
Qualitative Research
Qualitative Research is primarily exploratory research. It is used to gain an understanding of underlying reasons, opinions, and motivations. It provides insights into the problem, or helps to develop ideas or hypotheses for potential quantitative research.
Qualitative Research is also used to uncover trends in thought and opinions, and dive deeper into the concern. Qualitative data collection methods vary, using unstructured or semi-structured techniques.
Some common methods include focus groups (group discussions), individual interviews, and participation/observations. The sample size is typically small, and respondents are selected to fulfil a given quota.
Quantitative Research
Quantitative research is used to quantify the concern by way of generating numerical data, or data that can be transformed into usable statistics. It is used to quantify attitudes, opinions, behaviors, and other defined variables – and generalizes results from a larger sample population.
Quantitative research uses measurable data to formulate facts and uncover patterns in research. Quantitative data collection methods are much more structured than Qualitative data collection methods.
This type of data collection methods include various forms of surveys – online surveys, paper surveys, mobile surveys and kiosk surveys, face-to-face interviews, telephone interviews, longitudinal studies, website interceptors, online polls, and systematic observations.
Here's a simple look at the difference between qualitative and quantitative data:
- The age of your car (quantitative)
- The number of hairs on your knuckle (quantitative)
- The softness of a cat (qualitative)
- The color of the sky (qualitative)
- The number of pennies in your pocket (quantitative)
What methodology am I using with Audiense Insights?
Think of Audiense as if you were doing a survey with a set number of answers, that are the results of our Insights Report. By definition, when you use Audiense you are using a mixed research method given that it provides quantitative (i.e. demographics, interests, influencers, etc) and qualitative results (i.e. content). Nevertheless, if you don’t follow a quantitative research design, your research using Audiense will be interpreted as qualitative in the sense of exploratory research, to then inform better quantitative research.
Example:
Let’s say we want to understand the community of CEO’s in the UK.
I run an Audience Intelligence report on UK CEOs and let’s say Audiense finds 5,000 CEOs located in the US (Twitter users with CEO in their Bio)
At this point, I’m doing qualitative research in the sense of exploratory research.
- If you want to make it quantitative research, then you would need among other things included in the research design to quantify the total population to understand if the audience used for the report is significant enough.
Let’s say that I found in Google that the number of CEOs that are in the UK is around 200,000. Is the report generated by Audiense significant?
- Well, according to a sample size calculator, you would only need 384 with a margin error of 5%, and confidence level of 95% (usually recommended values) and therefore your population of 5,000 would be significant for your analysis.
Are your findings statistically significant if they are predominantly derived from Social Data?
Think of Audiense Insights as a survey targeting the most relevant people in your audience. If you are new to statistics, you may be surprised to learn from a sample of 17,000 people you attain a margin of error of less than 1% and confident level of 99% for any audience size.
- To learn more about statically significant samples, we recommend you go to this sample calculator or similar, http://www.raosoft.com/samplesize.html.
When you create audiences with Audiense Insights they are usually made up of a sample size of 250,000 people, depending on the filters and the criteria applied, which is far more than the required sample of 17,000.
It’s no secret that the use of social is more prominent within the younger generations. As a result, when analyzing an Audience of over 60s, it is essential to be diligent and cross-verify the insights extracted from a variety of sources.
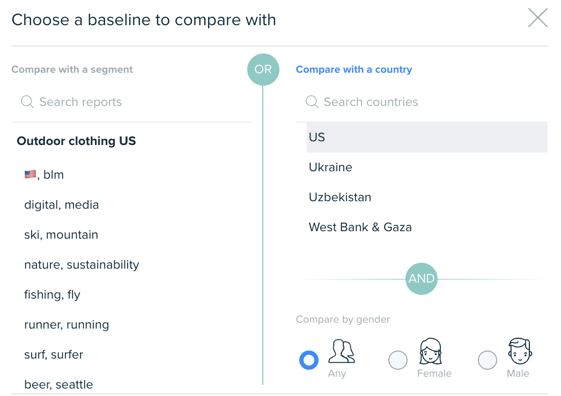
It is also important to take into account that the insights we provide are always compared to a baseline that is relevant to your audience (i.e. average Twitter users in a country, or the full audience when compared to a segment).
- This comparison increases relevancy as any biased (social data) influences both datasets, suggesting any over or under indexing attributes are highly specific and relevant insights for your audience.
Our audience coverage varies geographically, but there is almost always a statistically significant sample of data to extract valuable insights from. We have developed functionalities that allow you to access all the available data in order to find a significant sample of your target audience.
Audiense Insights & Connect Data Sources - FAQs
How do you link profiles to different networks?
- The only compliant way to do this:
- Gather information directly from the user with their consent
- Utilize available public data
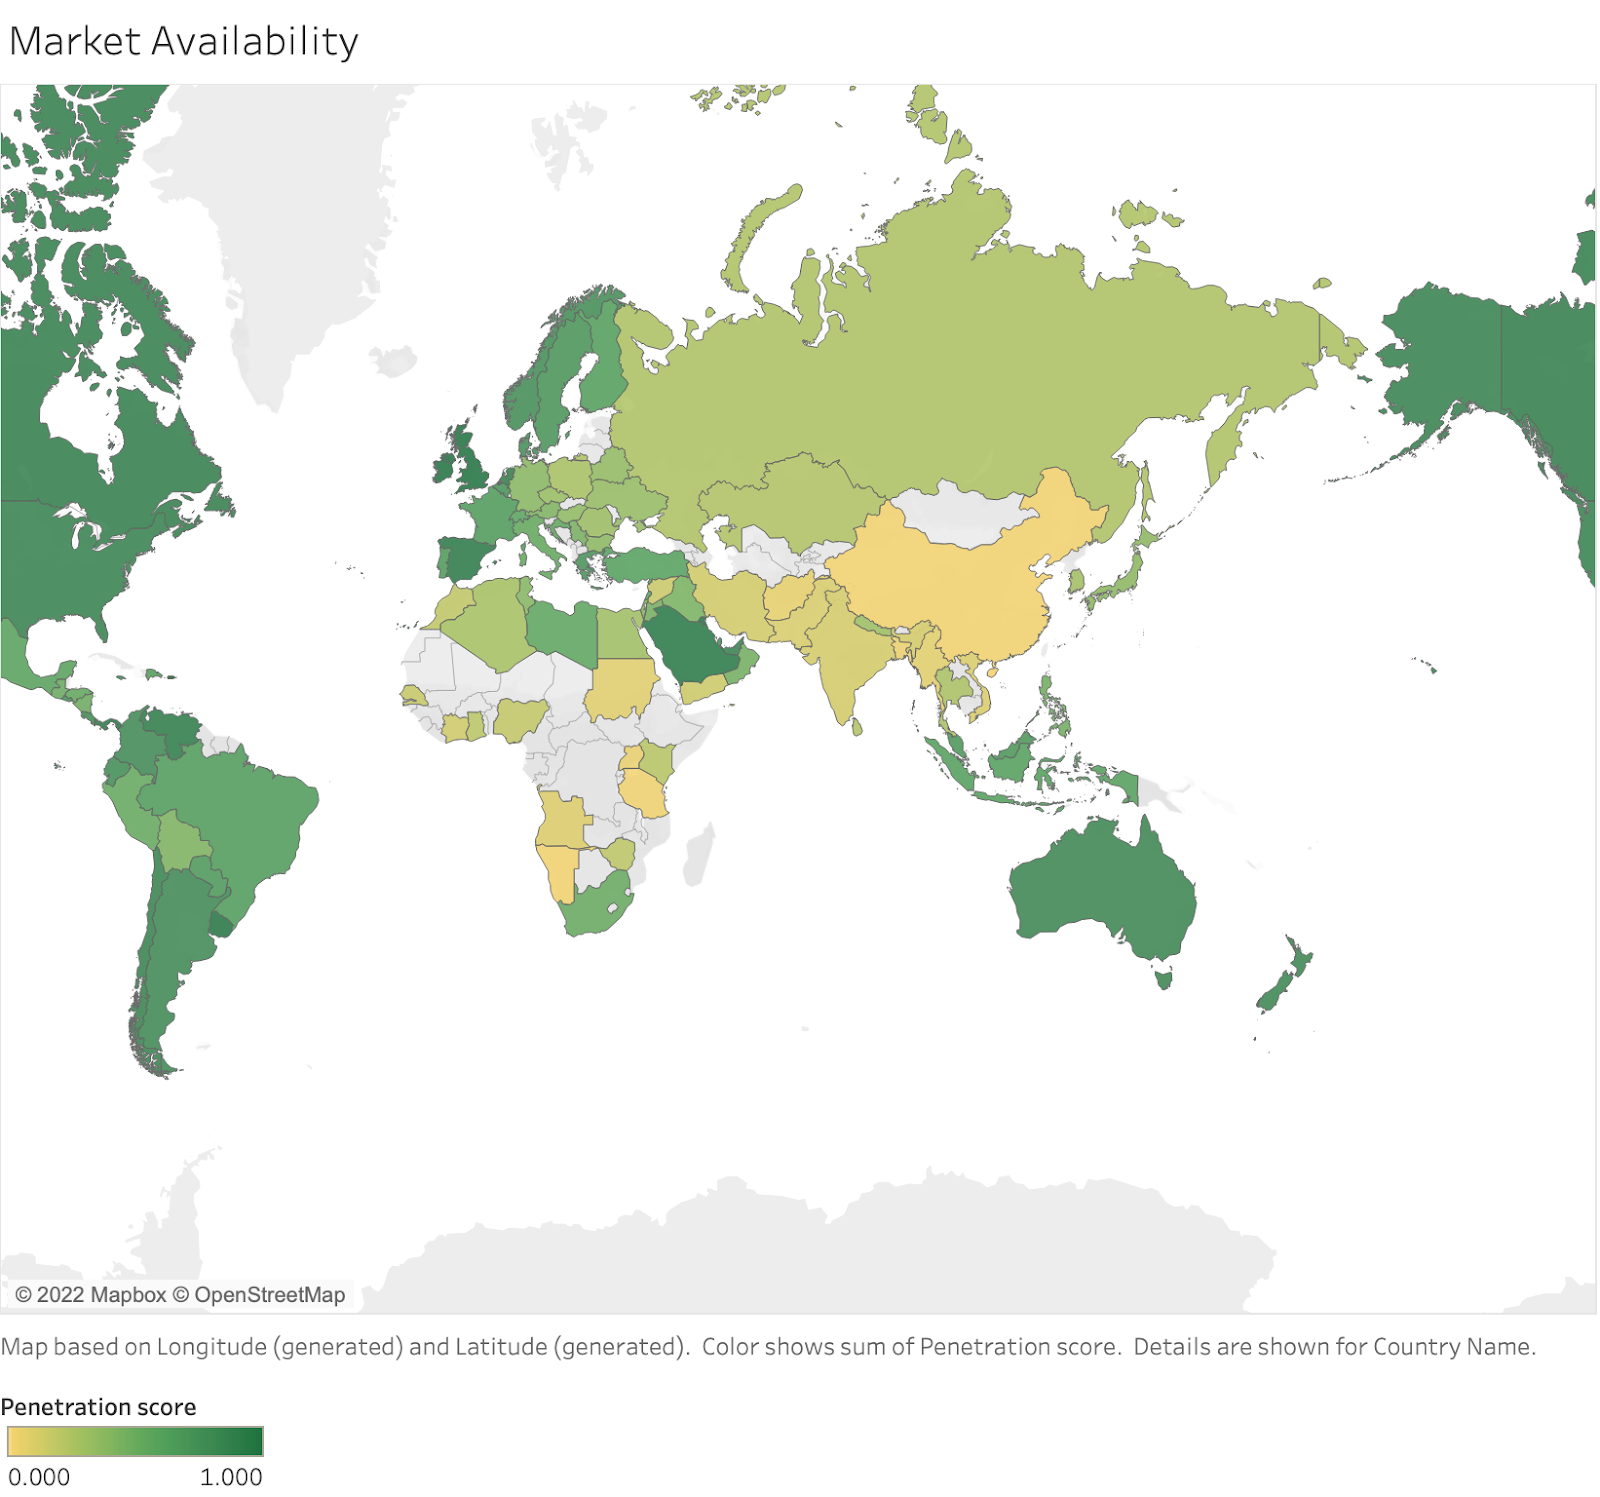
Availability: what market coverage does Audiense have?
- In the following image we have represented the countries with better availability in Green (i.e.UK), with a gradual change towards Yellow, which show those with worse availability (i.e. China)
Why and when is Twitter data excellent for research?
- Twitter data differs in nature from the data that researchers collect from traditional quantitative methods such as surveys or experiments.
- Survey data is researcher controlled and designed, whereas social media data can be viewed as more organic.
- While data quality is more likely ensured in surveys and experiments, as researchers have more control over which participants to recruit and what questions to ask, the emergent nature of social media discussions may offer researchers opportunities to identify new, previously unidentified perspectives and frames.
- “Newness” is a strength of social media data and is especially useful for studying emerging life science issues where the right questions to ask are elusive. However, data newness comes with a data quality challenge that requires researchers to develop methods to indirectly evaluate user characteristics such as identity and motivations.
- Removing “the Twitter Bias”: Thanks to segmentation and benchmarking the most unique and relevant characteristics, hobbies and passions for each of the segments are surfaced, offering marketers and researchers the opportunity to dig into what the real sources of influence are for them.
- Traditional market research is time-consuming and costly: Twitter gives you access to the world’s largest pool of open online consumer discussion, lets you monitor conversation across the web, and collect years of historical data to compare with and to answer questions faster.
- Real-time results: Surveys and focus groups can take weeks to collect and analyze insights from. With Twitter, users gather data in real-time, answering questions faster and keeping up with the ever-changing market.
- Next-gen market research: Traditional market research can only get you so far. To see the complete picture, take a look at how people communicate online, as well as their hobbies and passions. With this product, you can leverage Twitter data to discover more about your consumers.
Data Beyond Twitter: Which data/how is the data incorporated in the insights?
- Our approach is to always try to surface what is more relevant to understand the audience being analyzed. That’s why it’s very important to emphasize the benchmarking in each of our reports with respect to the baseline (Total/Full Audience). In that way, you are able to remove the “Twitter bias”.
- Twitter is a cross media platform where, for example, there are 500,000,000 Instagram posts shared via Twitter every month. We use behaviors like this to provide insights across our Content Tab or Online habits.
- As social is an unstructured, non-declarative world, some of the variables are inferred, where we expand the Twitter data with other data sets:
What qualitative data can Audiense Insights provide?
- Emphasis should be made on the ability to apply Social Consumer Segmentation to any audience, and identify hidden trends and affinities that appeal to an audience (i.e. Podcasters, Twitchers, Journalists, etc. that they follow and engage with), as well as combine social listening to uncover specific audiences and their conversations.
- These 2 examples show very quickly the value of these qualitative insights:
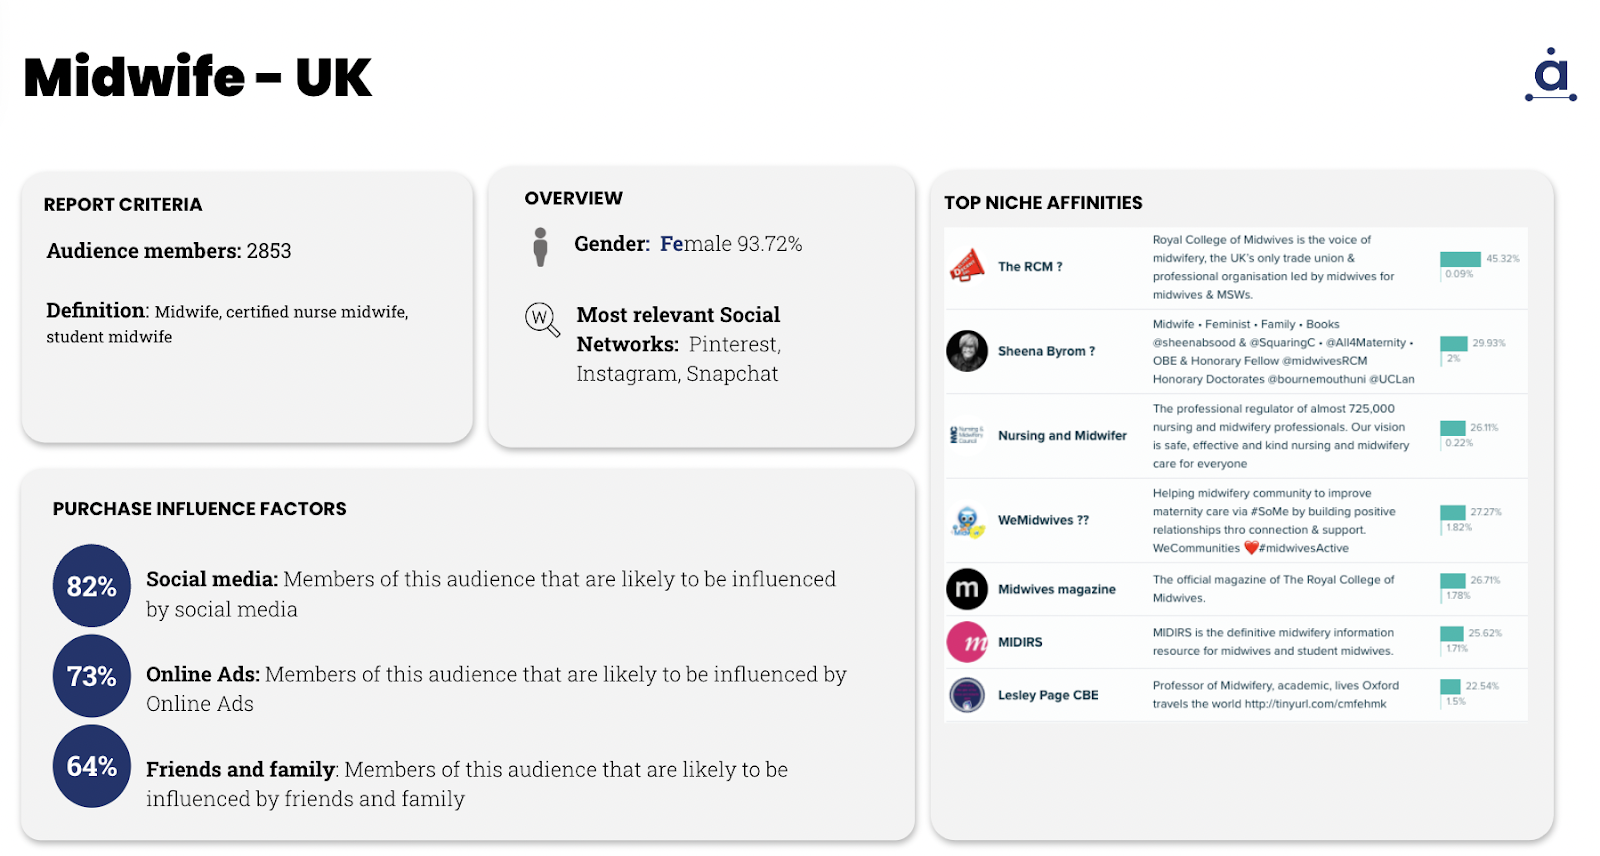
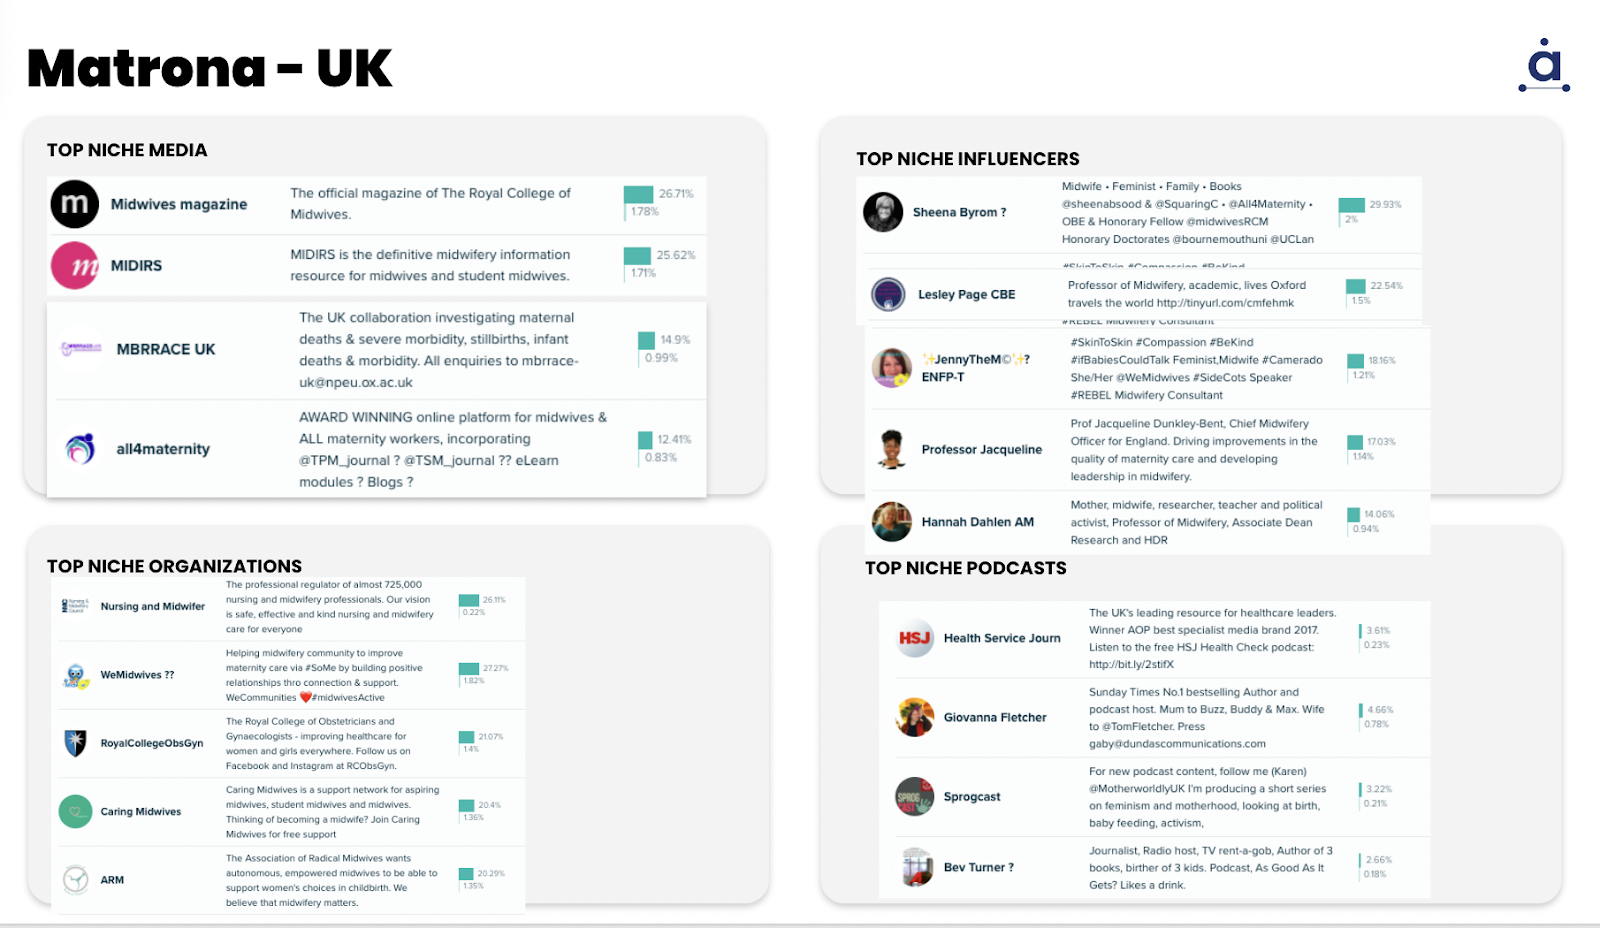
- One of our customers within Healthcare expanded their knowledge of the Midwife persona across different countries, including UK, US, Spain and France to name a few. In these screenshots you can see a simple example including niche influencers, podcasts, and media they follow and engage with. They were able to identify cultural differences, and new unknown affinities through this analysis.
-
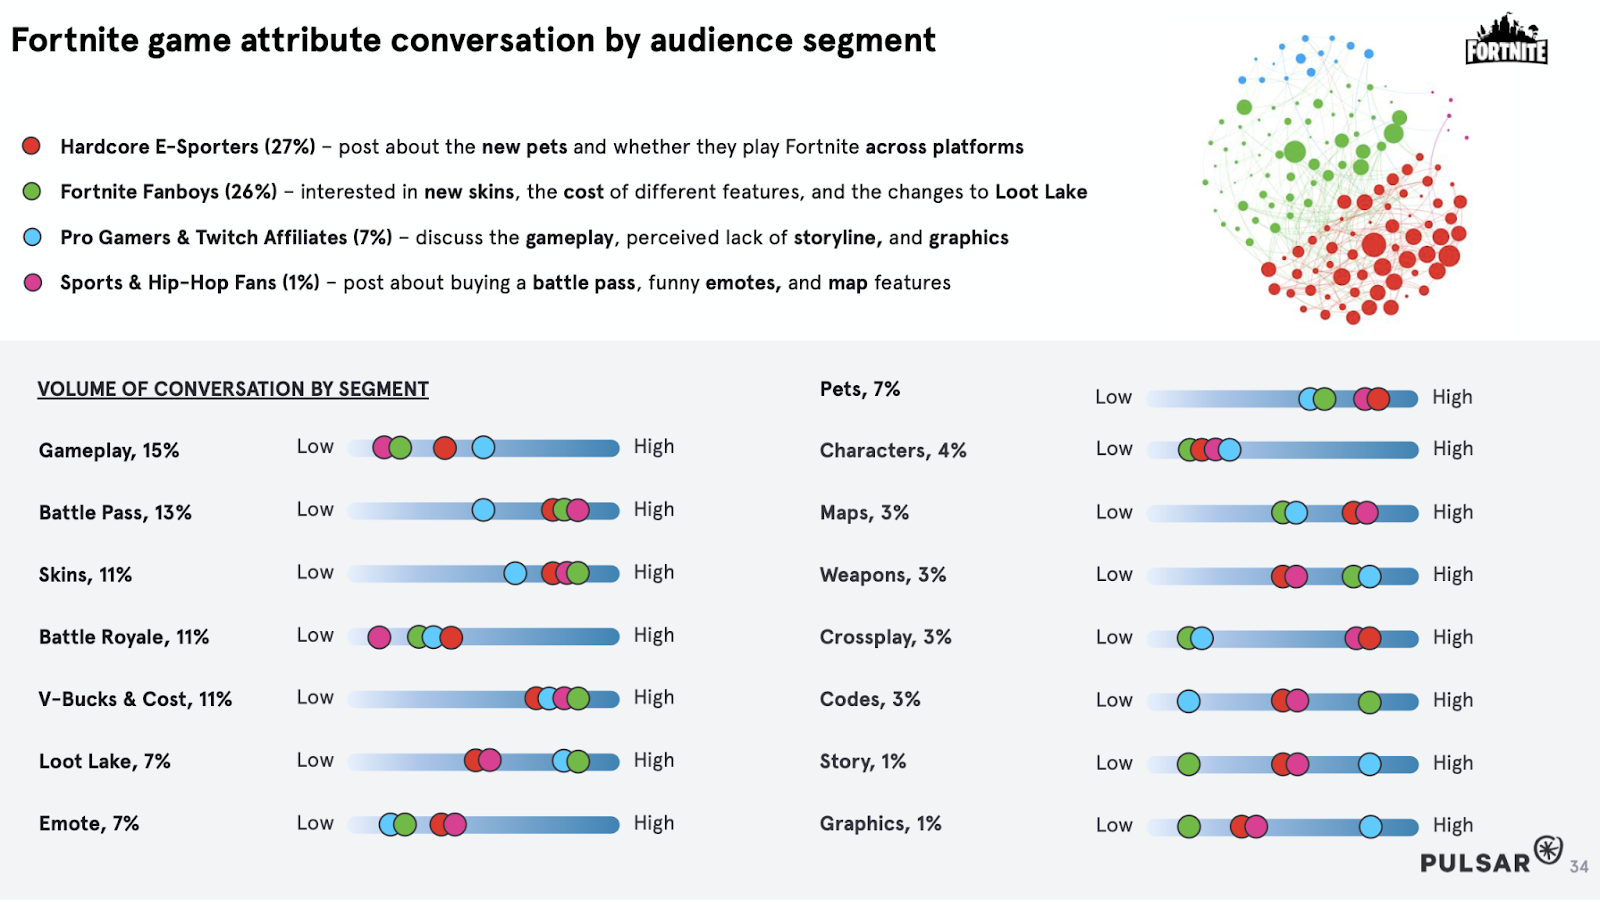
- In this other example, combining with Social Listening (in this case Pulsar platform), you can see the segmented conversation based on the different cultural communities, where the granularity of the segmentation is highlighted (Dedicated Gamers & E-Sporters vs Fortnite Fanboys):

Example Case Studies:
- One: How audience intelligence helped a leading medical technology brand to shape a winning, client-first strategy
- Ability to integrate with social listening, uncovering in-depth analysis of audiences, understand their unique needs, values and personality to build an accurate persona, and deep dive into conversations to understand the market.
- Two: How consumer insights helped a CBD ecommerce platform identify and engage micro-influencers
- Identifying Micro-influencers in a niche market
- Three: How audience insights helped a world-famous opera house succeed in the digital age
-
- Reaching new audiences: In this example, an opera house was able to expand into the digital age, appealing to a younger audience.
SOPRISM by Audiense (Meta Audience Insights)
SOPRISM will give you access to the biggest behavioral consumer panel with 2.7 billion users worldwide being profiled daily from their interactions, digital browsing journey and content consumption to identify their genuine passion, interests, brand affinities, media relationships and even societal concerns. It will provide insights for any active audience on Meta and beyond, digitally, to improve your overall audience-centric marketing strategies.
With Audiense' recent acquisition of SOPRISM, this extraordinary consumer insights tool is now under the Audiense umbrella, and suite of platfroms that can be used to complatement eachother. Read more about the acquisition here.
SOPRISM Data FAQs:
1. Where does the SOPRISM data come from?
The data you can find on SOPRISM comes from the ad management tool developed by Facebook which aggregates the data of several networks with proprietary applications such as Instagram, Messenger, etc. Overall, with more than 2.7 billion active users throughout the world, SOPRISM offers complete access to the largest database based on declarative, behavioral, and socio-demographic information.
2. What is SOPRISM’s methodology for generating audiences?
For each audience being profiled, we enable over 7000 criteria points including socio-demographic, interest and behavioral attributes that are compared against a baseline audience. This process makes it possible to benchmark the target audience against another (i.e. a country’s population on Meta), allowing you to identify what is unique about your audience.
SOPRISM organizes these insights into thematic universes to provide a cross-sectional analysis of over- and under-represented characteristics, with continuous enrichment being applied to improve the quality of the audience insights.
3. Does SOPRISM respect the GDPR norms and directives?
Yes, SOPRISM respects the GDPR norms and directives. The platform uses the available aggregated and anonymized data thanks to the Facebook API, which means that no personal information is collected or processed in the audience analysis framework. The Belgian data protection authority performed an audit of the platform and has confirmed that SOPRISM does not process data which is considered to be sensitive.
For more information: https://www.facebook.com/policy.php
4. What is Facebook’s ability to understand its active users?
According to a study conducted by researchers from Cambridge and Stanford universities, Facebook knows its users better than their own families do, starting from the moment they click on the “like” button more than 150 times for content present in the Facebook ecosystem. This study has shown that Facebook has the ability to define the personality and interests of a person with great precision starting from certain level of activity of a user on its social networks.
5. What type of informations does Facebook process to understand an audience?
-
DECLARED INFORMATION
Facebook makes an inventory of the information declared by the member : profile, e-mail address, phone numbers, shared interests when building the user account, membership in a community, registration with groups, participation in events, etc.
- INFORMATION COLLECTED
Facebook collects the information related to the member: IP Adress, geolocalization data, browser, device model, battery level, etc.
- BEHAVIOR IN THE APPLICATION
Facebook improves the understanding of its members through interactions in its social networks & apps:
- Visible interactions which are performed in the user’s FB / Insta account (Likes / Comments / Shares, Posts, etc.)
- Invisible interactions are also taken into account (Ad clicks, Video views, Search engine requests, Marketplace, etc.)
- Content consumption, such as: if one spends a lot of time looking at cooking videos the FB algorithms will identify a potential interest in cooking. (Time spent on each content, News feed, average speed scroll, etc. )
- BEHAVIOR ON THE WEB
The FB algorithms take into account different types of behavior on the web:
- Activities and time spent on pages and websites that have tracking pixels;
- Activities behind Facebook connect;
- Activities on pages that have a Facebook plug-in (“LIke” button, etc.);
- Activities in the Facebook ad network, etc.
For more FAQs about Soprism data, please visit this link.